| Data Product | Description |
|---|---|
| Level 0 | Raw collected telemetry |
| Level 1a | Reconstructed, depacketized, uncompressed data, time referenced, annotated with ancillary information reassembled into scenes |
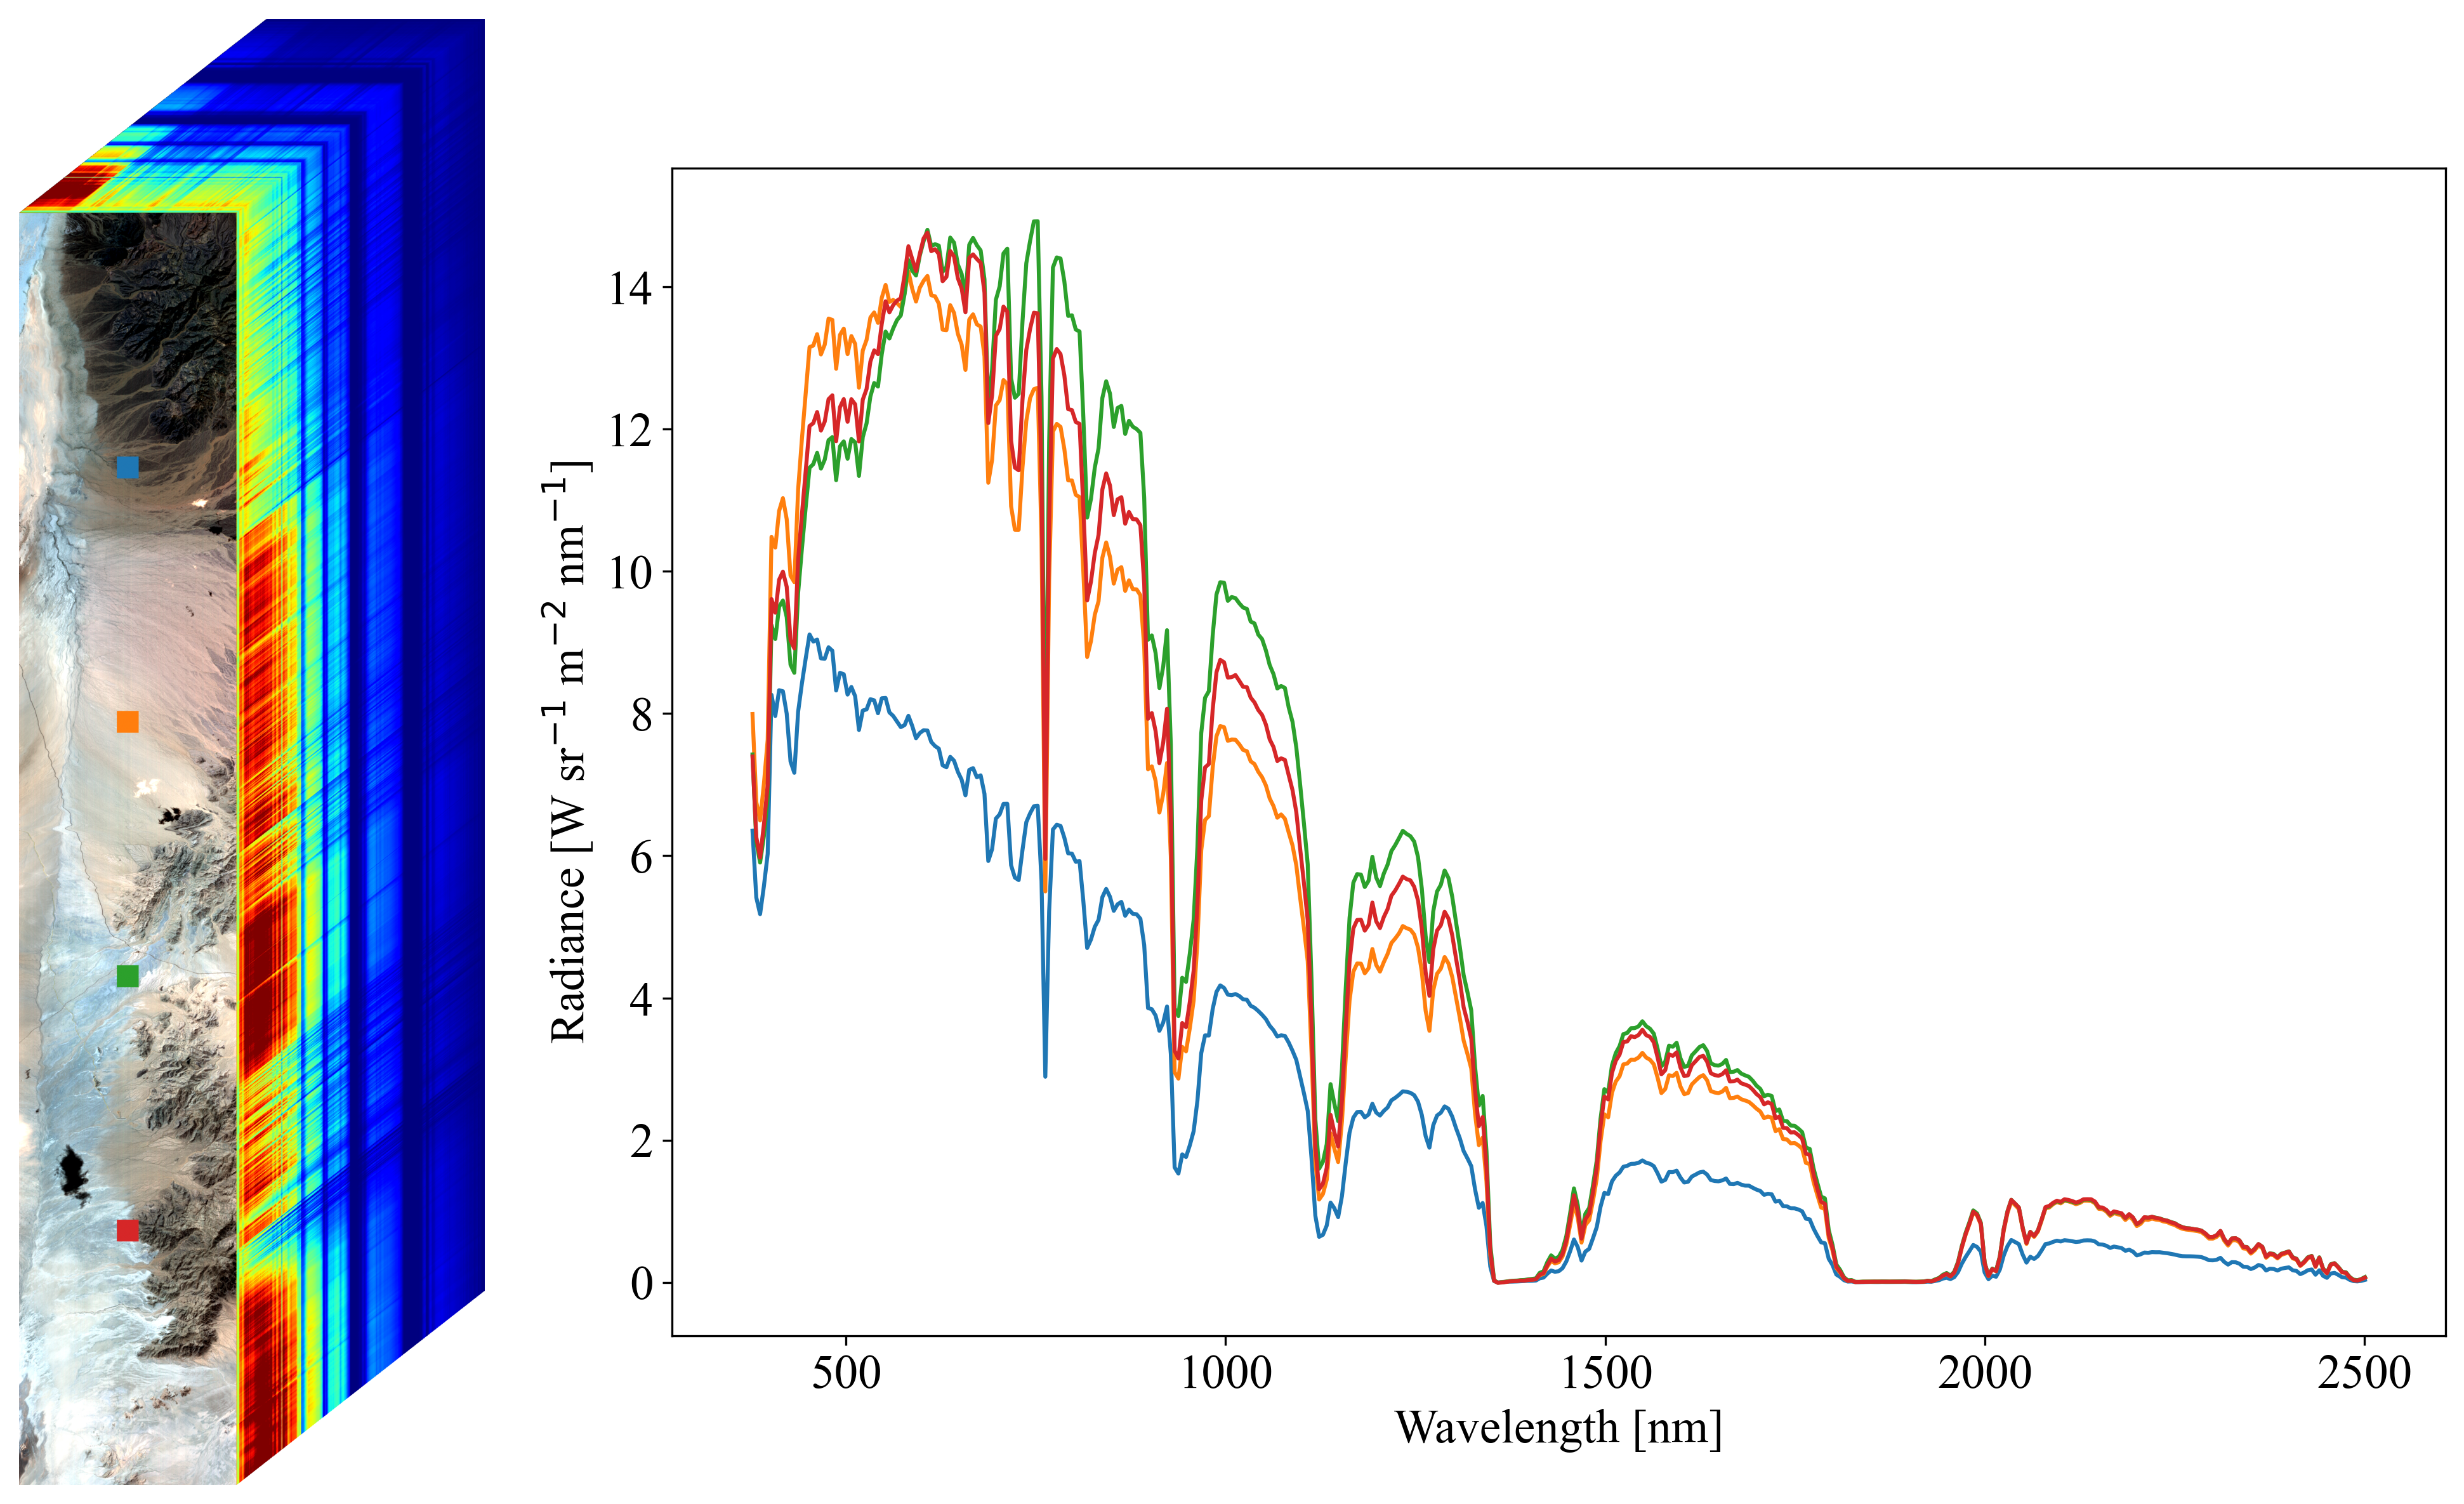
| Level 1b | Level 1a data processed to sensor units including geolocation and observation geometry information |
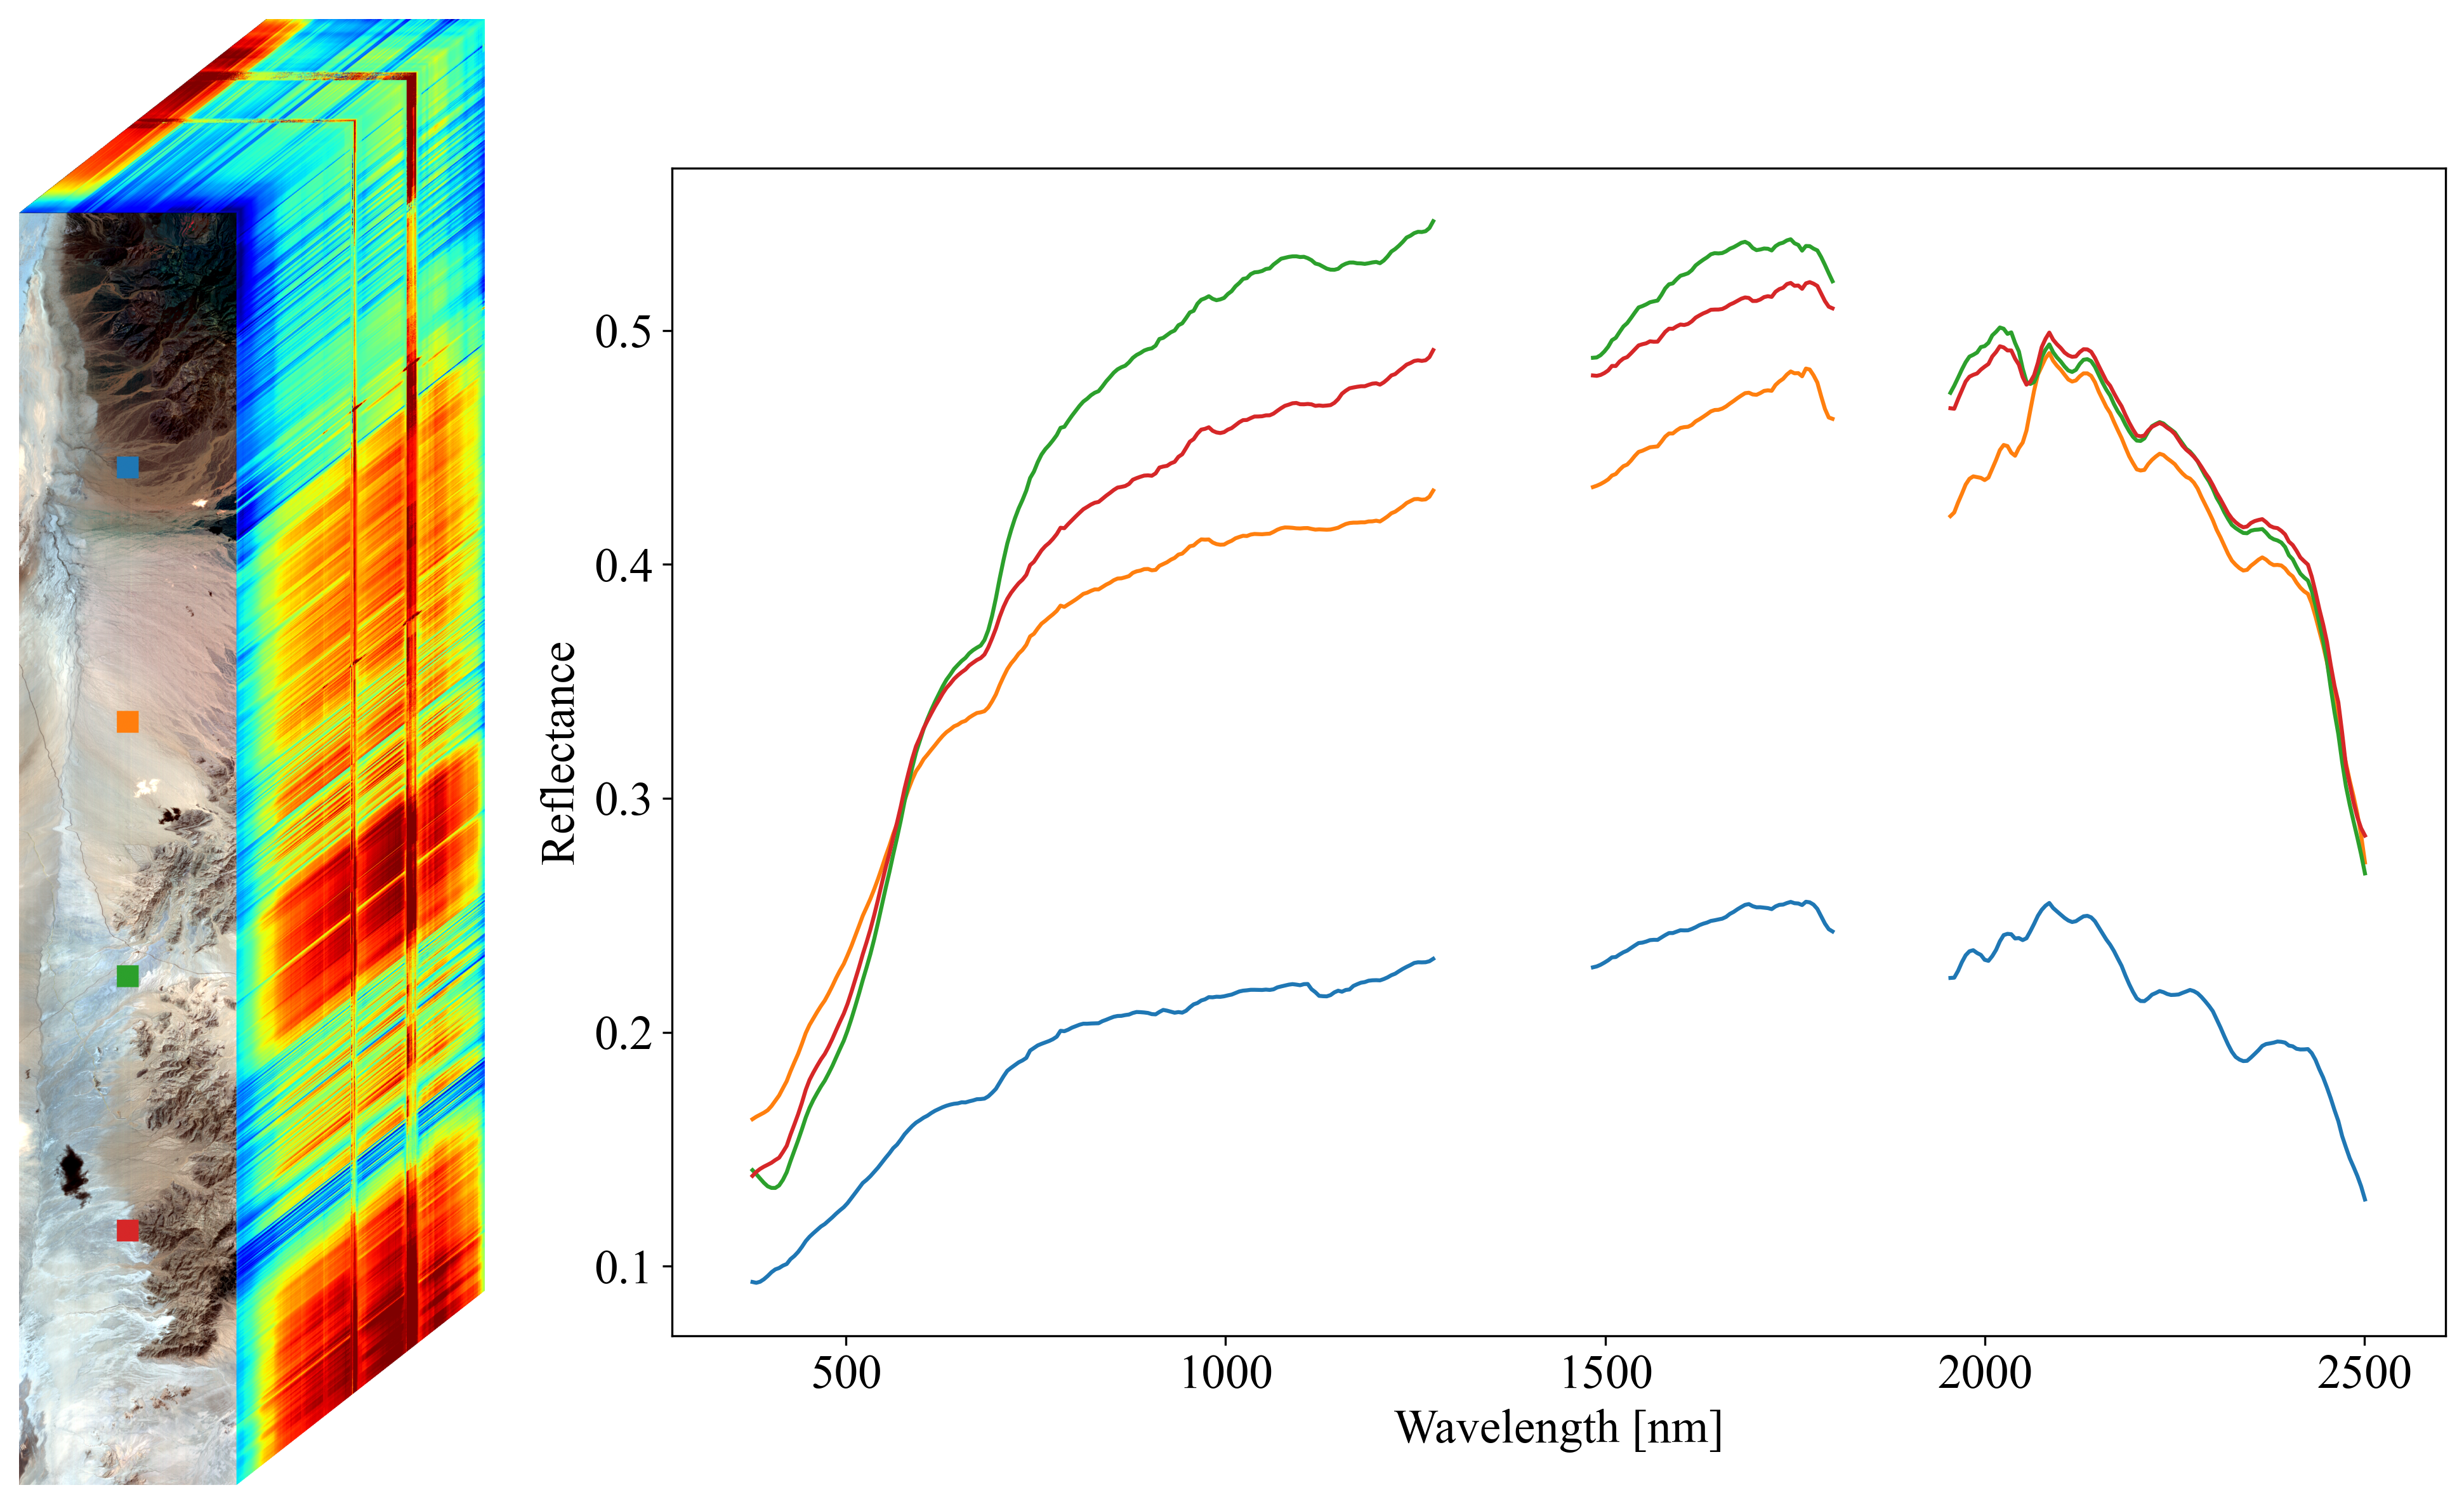
| Level 2a | Surface reflectance derived by screening clouds and correction for atmospheric effects |
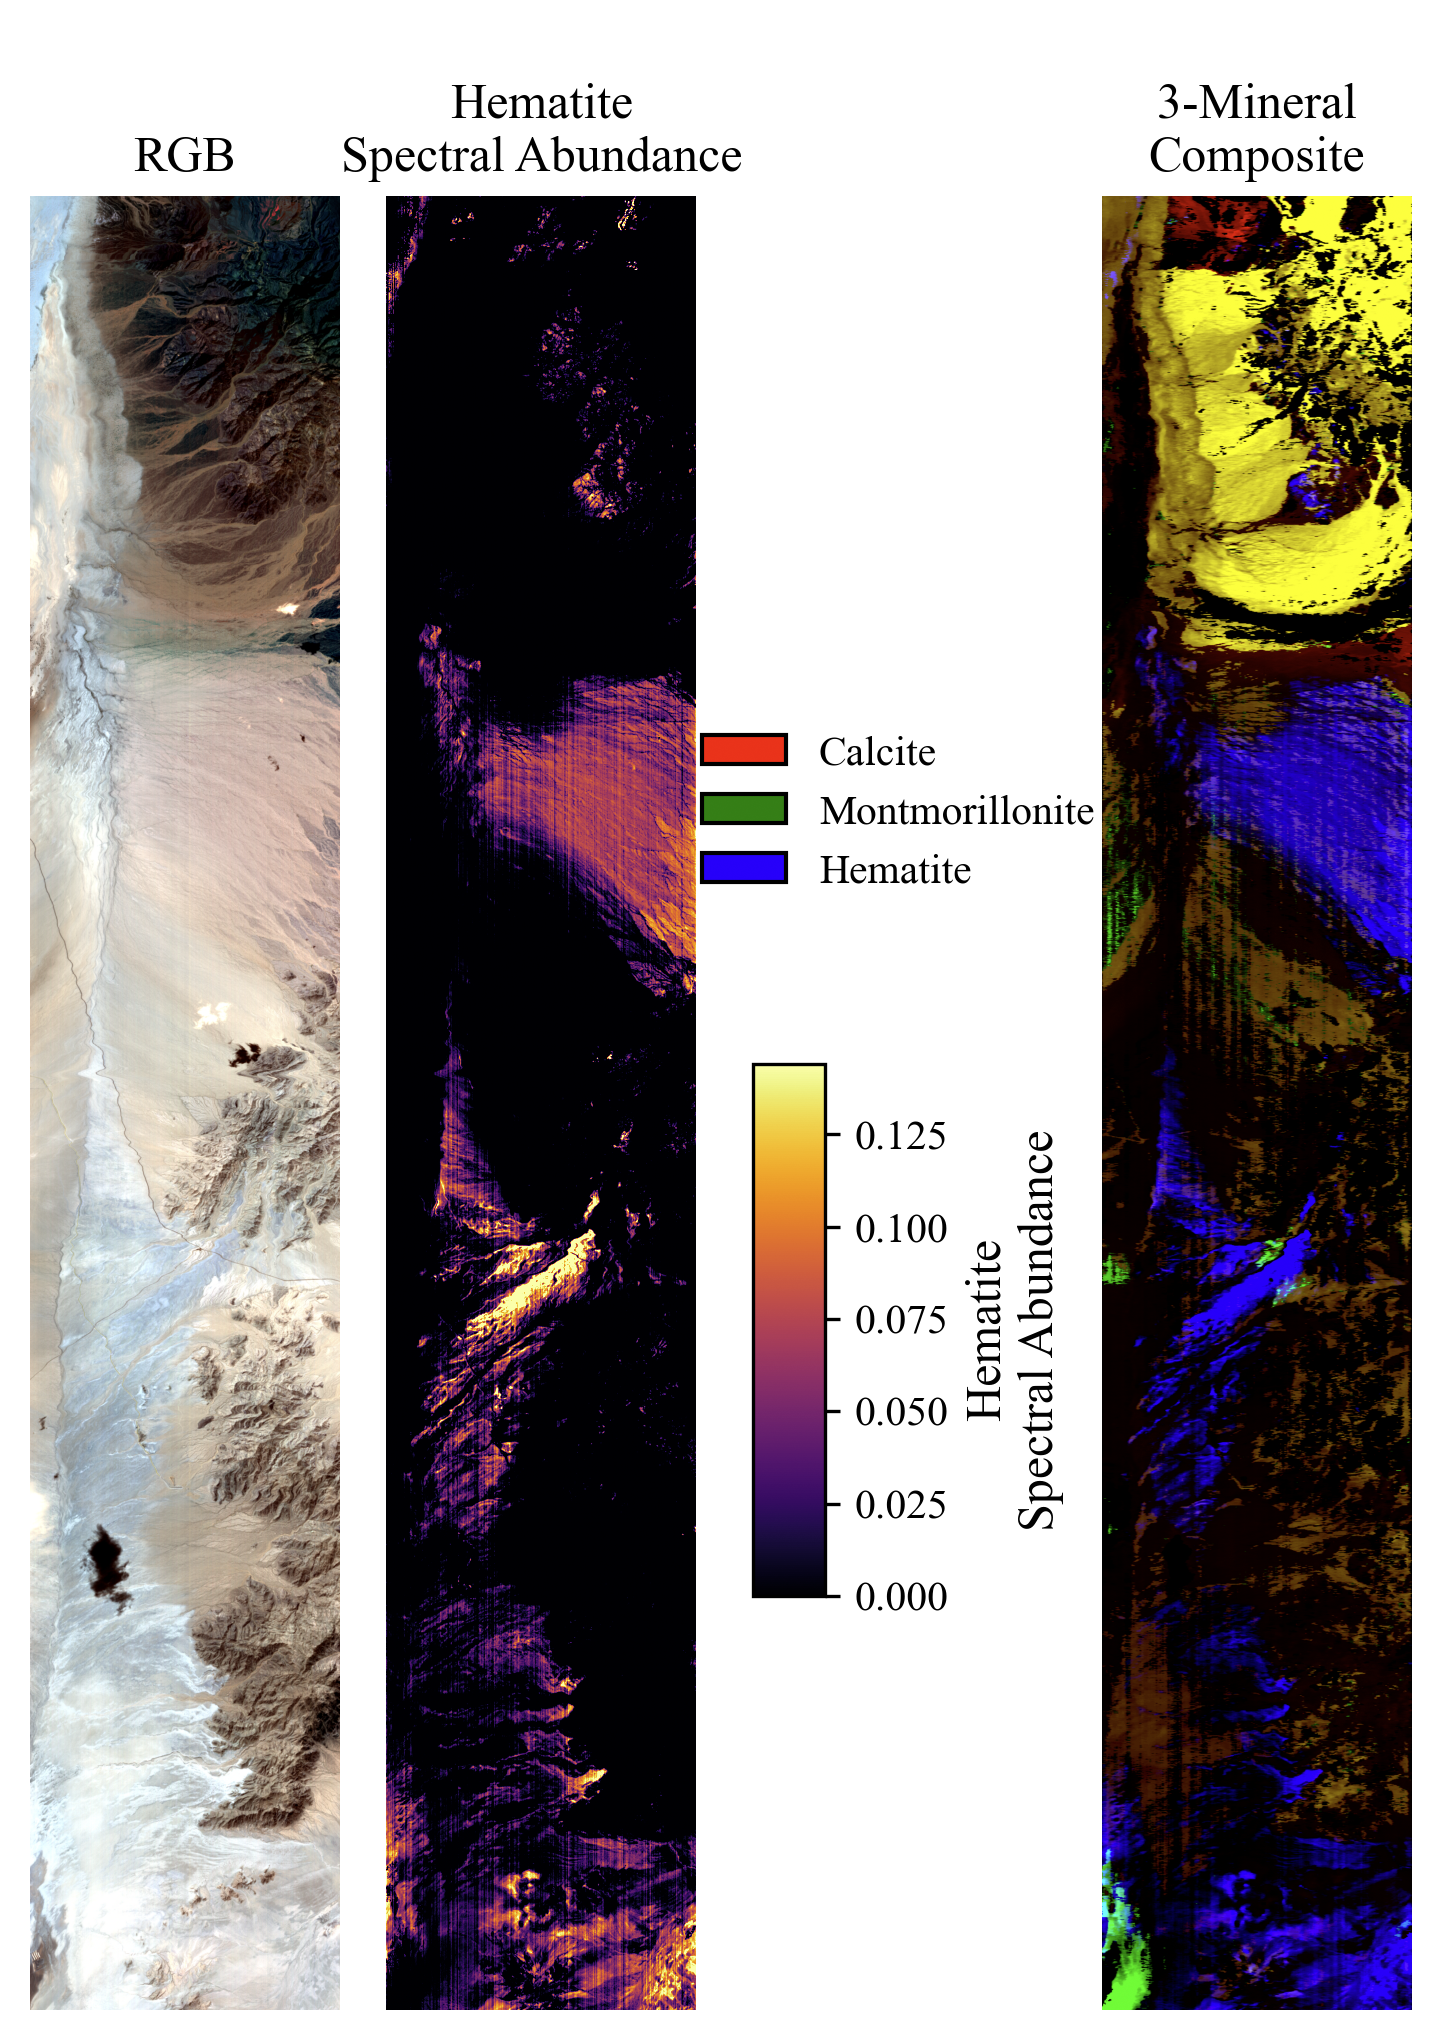
| Level 2b | Mineralogy derived from fitting reflectance spectra, screening for non-mineralogical components |
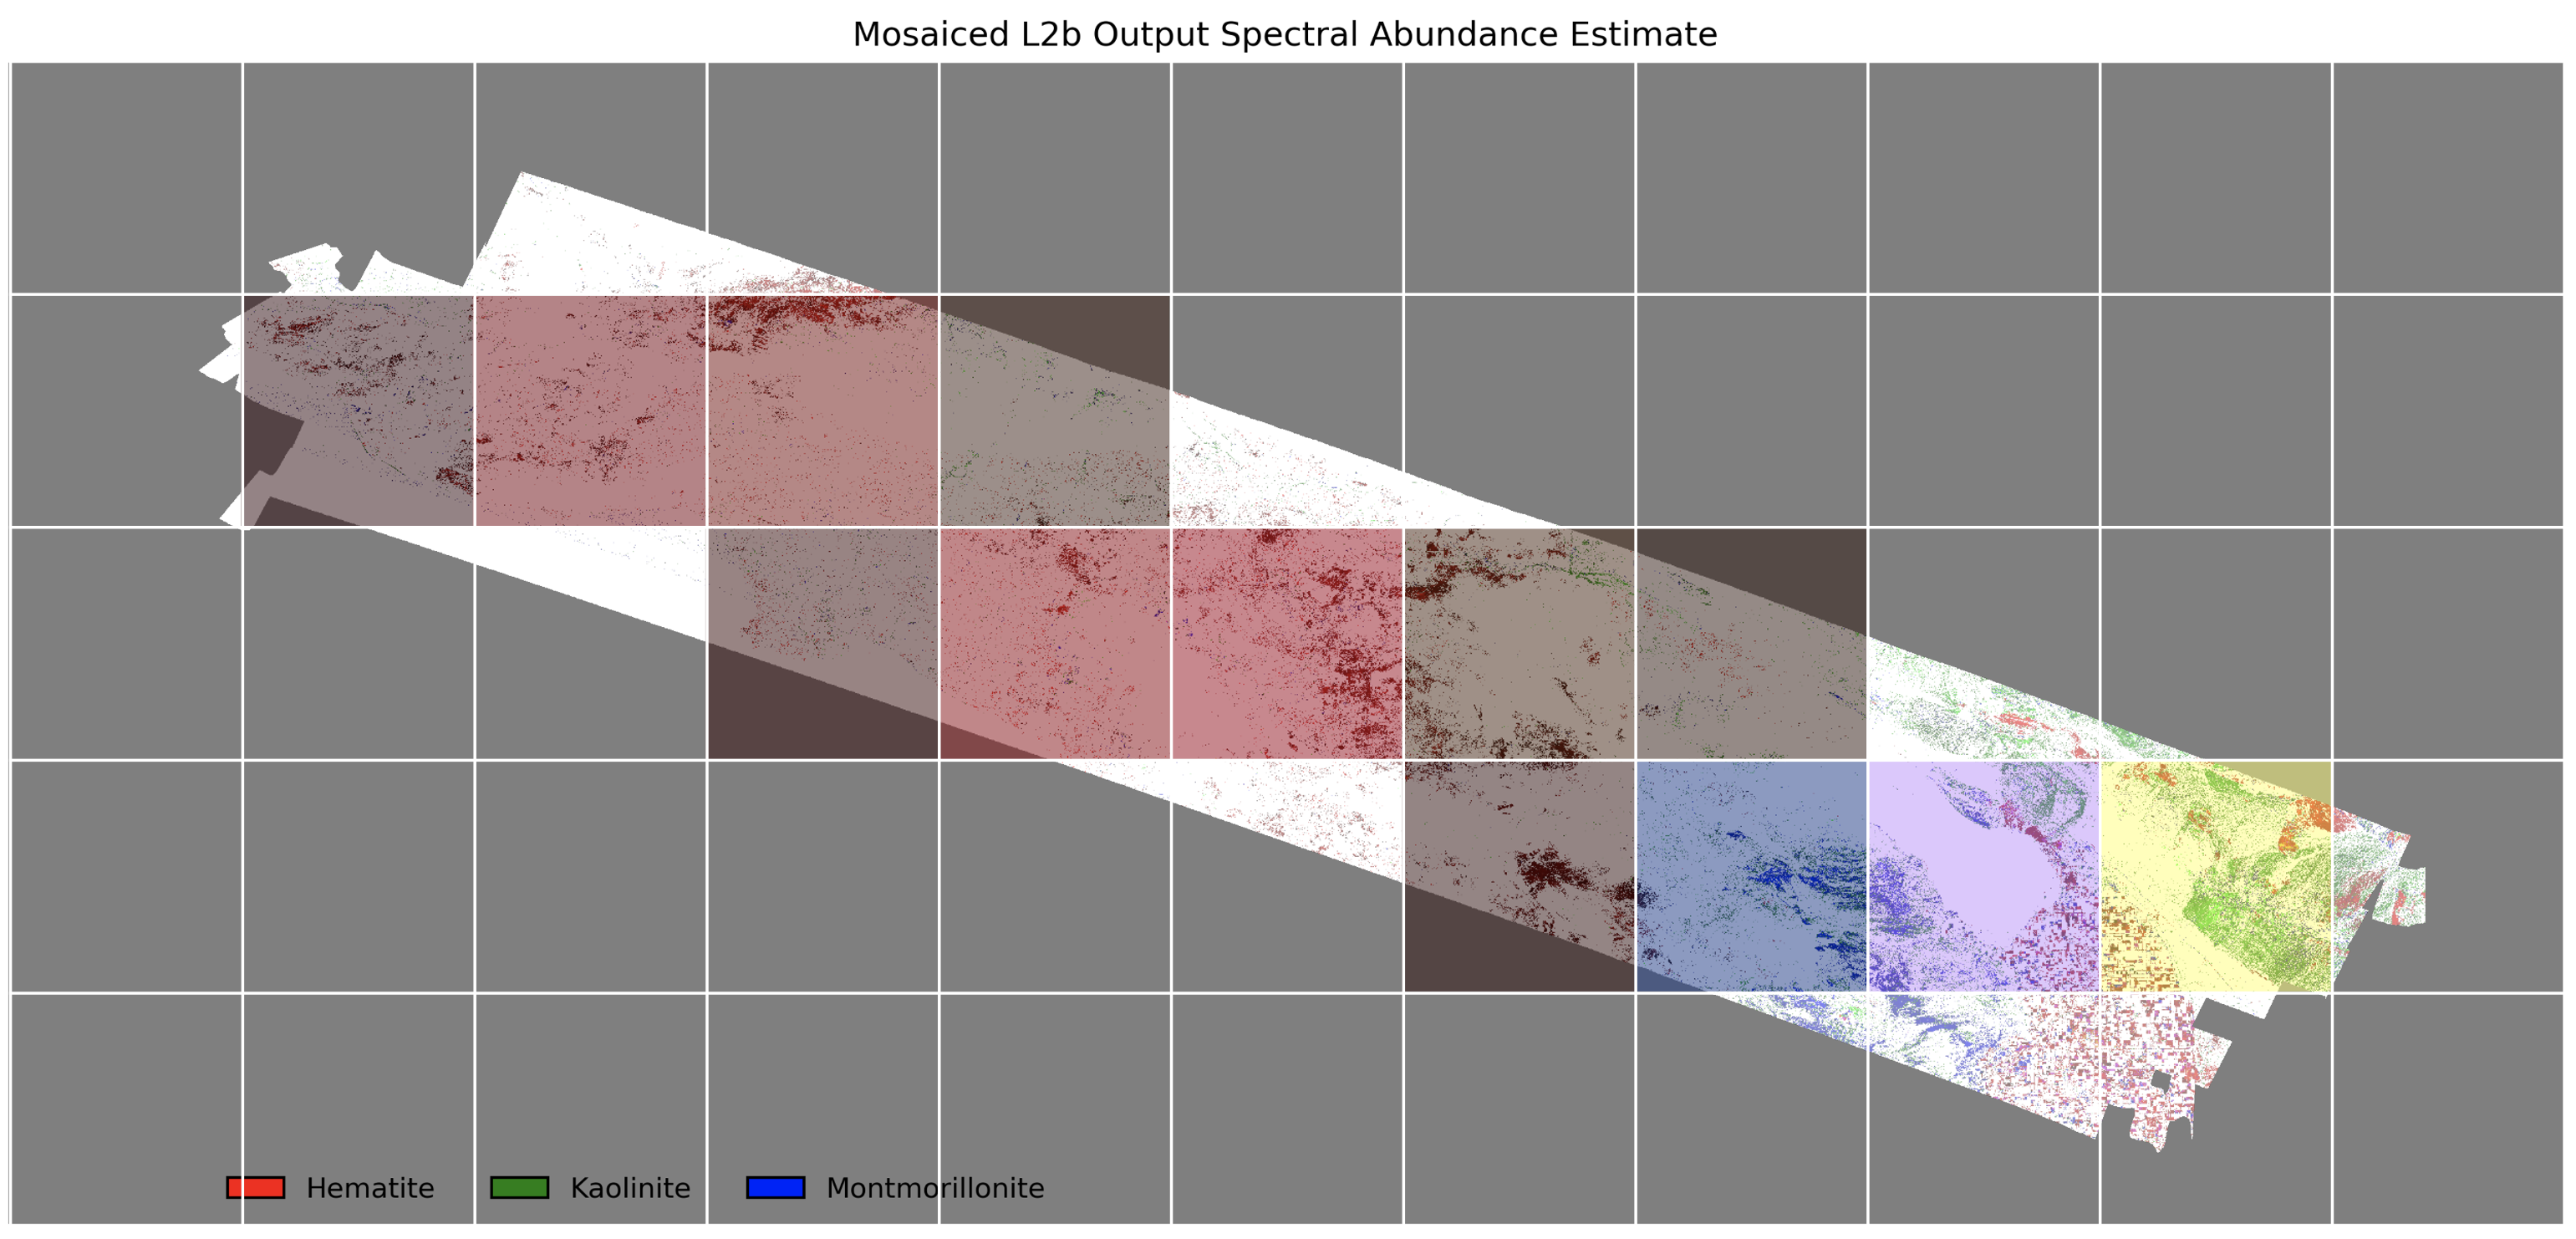
| Level 3 | Gridded map of mineral composition aggregated from level 2b with uncertainties and quality flags |
| Level 4 | Earth System Model runs to address science objectives |
The EMIT mission will provide a suite of data products for all areas successfully measured below the International Space Station. These data and derived products will be used to achieve the EMIT science objectives, reducing the uncertainty in mineral dust radiative forcing. All measurements will be delivered to the NASA Land Processes Distributed Active Archive Center and made available to the broader community for the additional Earth science investigations it can enable.
The EMIT data products for each stage of analysis from Level 1b to Level 4 are described in a series of Algorithm Theoretical Basis Documents (ATBDs). These describe the theoretical foundations for each stage of the analysis, define the quantities in the data files, and provide guidance on interpretation. Uncertainty predictions are distributed with all products.
Level 1b (Radiance at Sensor) ATBD (PDF)
Level 2a (Surface Reflectance) ATBD (PDF)
Level 2b (Surface Mineralogy) ATBD (PDF)
Level 3 (Aggregated Surface Mineralogy) ATBD (PDF)
Level 4 (Earth System Model Runs) ATBD (PDF)
An example visual walk-through of products L1b-L3 is provided in below.