This portal shows high-confidence research grade methane plume complexes from point source emitters - updated as they are identified - in keeping with our Open Science and Open Data policy. These results will enable user groups and the public to access the information quickly and utilize the data. This mapping effort is a prototype component of the NASA Earth Science contribution to a U.S. Government Greenhouse Gas (GHG) information system.

08/28/2023: We have updated our portal! New and improved algorithms have been implemented, and you may see some changes as a result. Data products are now also available at the LP DAAC, along with a detailed User Guide and Algorithm Theoretical Basis Document - click on plumes below for one-click data downloads.


Legend Full

Using the Map

Scroll and pan around this map to see the latest coverage and data products. Key features are shown below with details broken out in sections.

Feature Overview

(PDF)

Layer Tool

Multiple data layers are available for viewing, and can be toggled on and off:

layerinfo

(PDF)

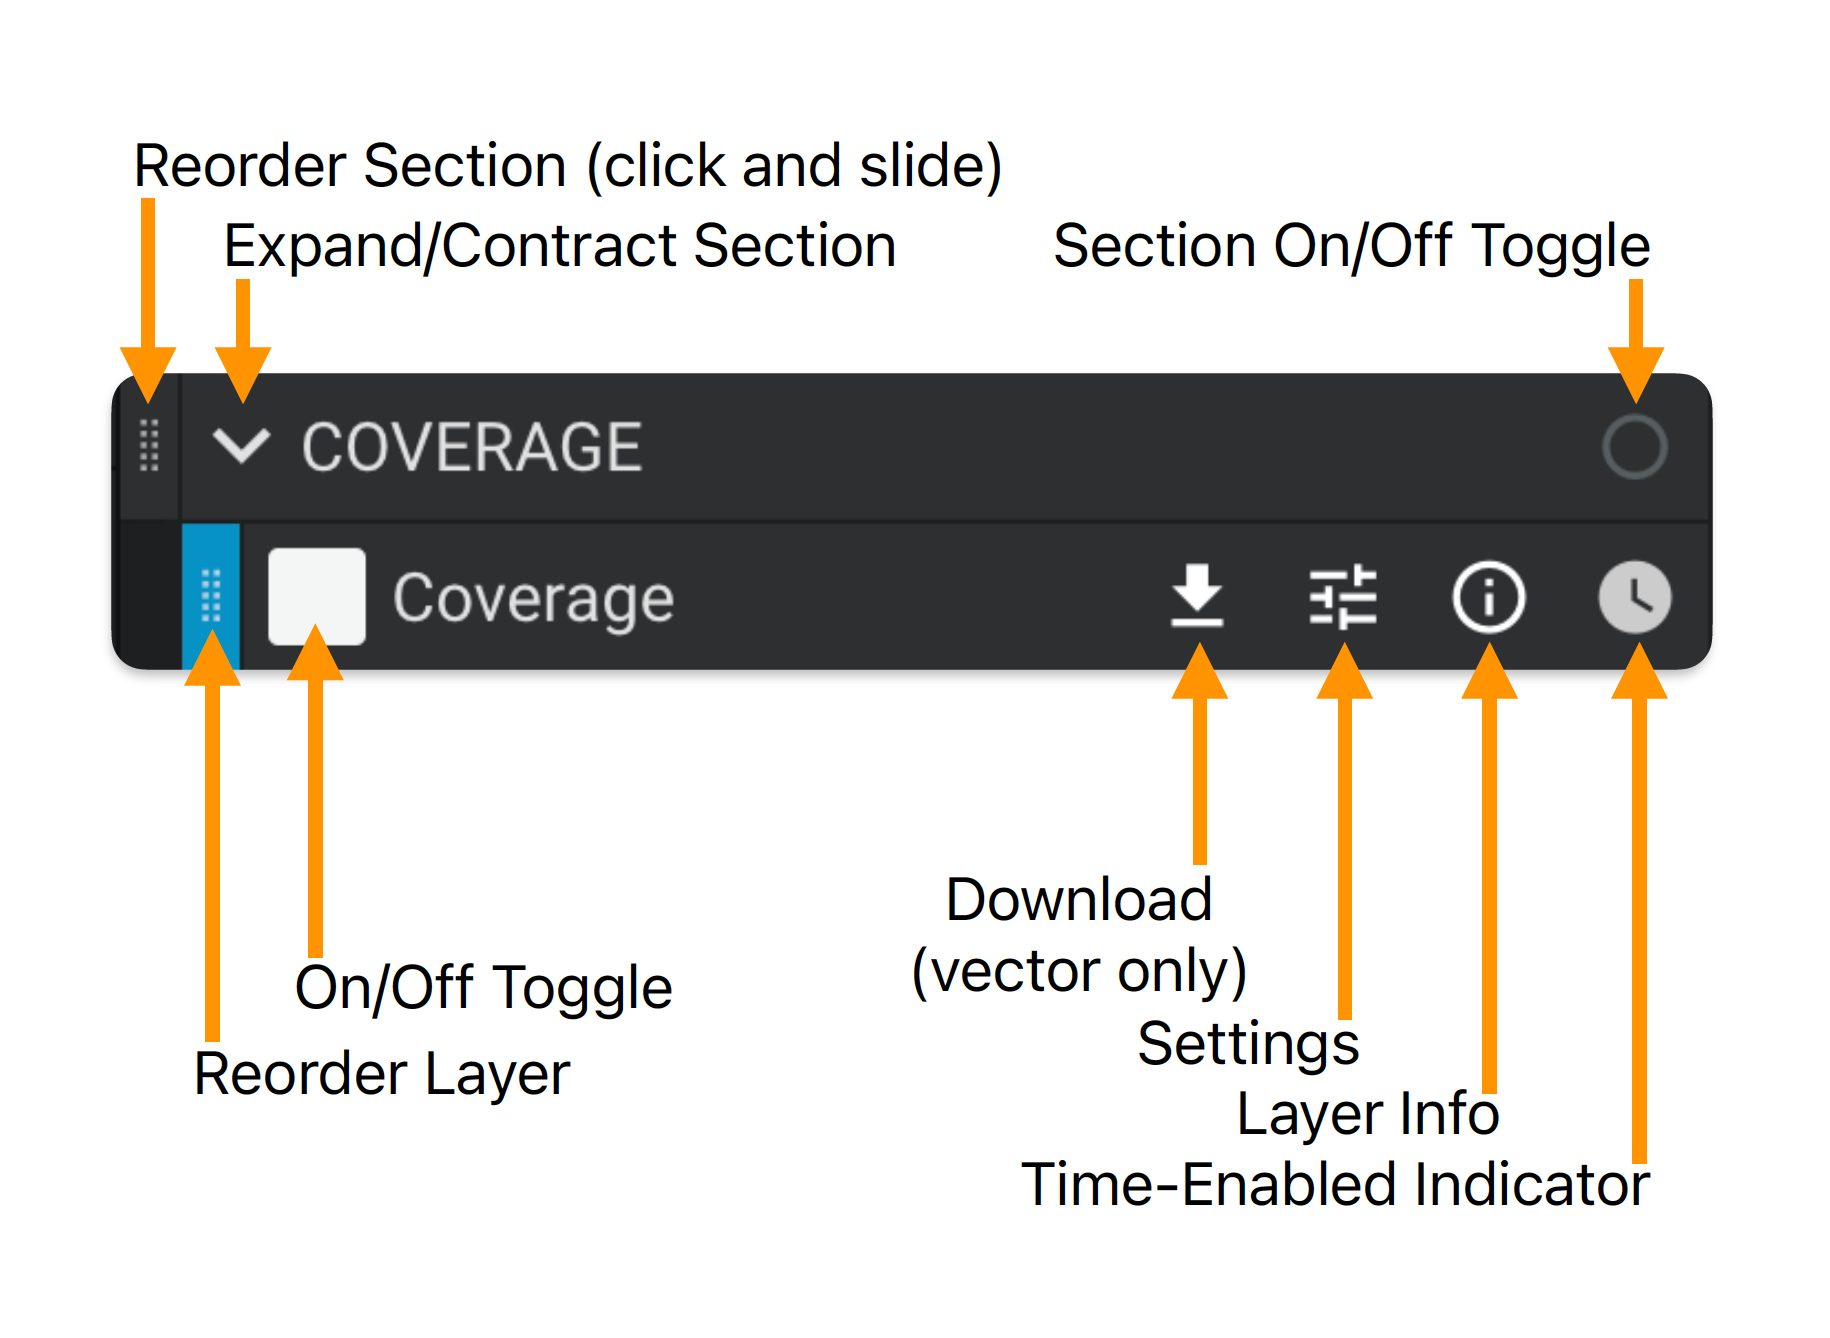
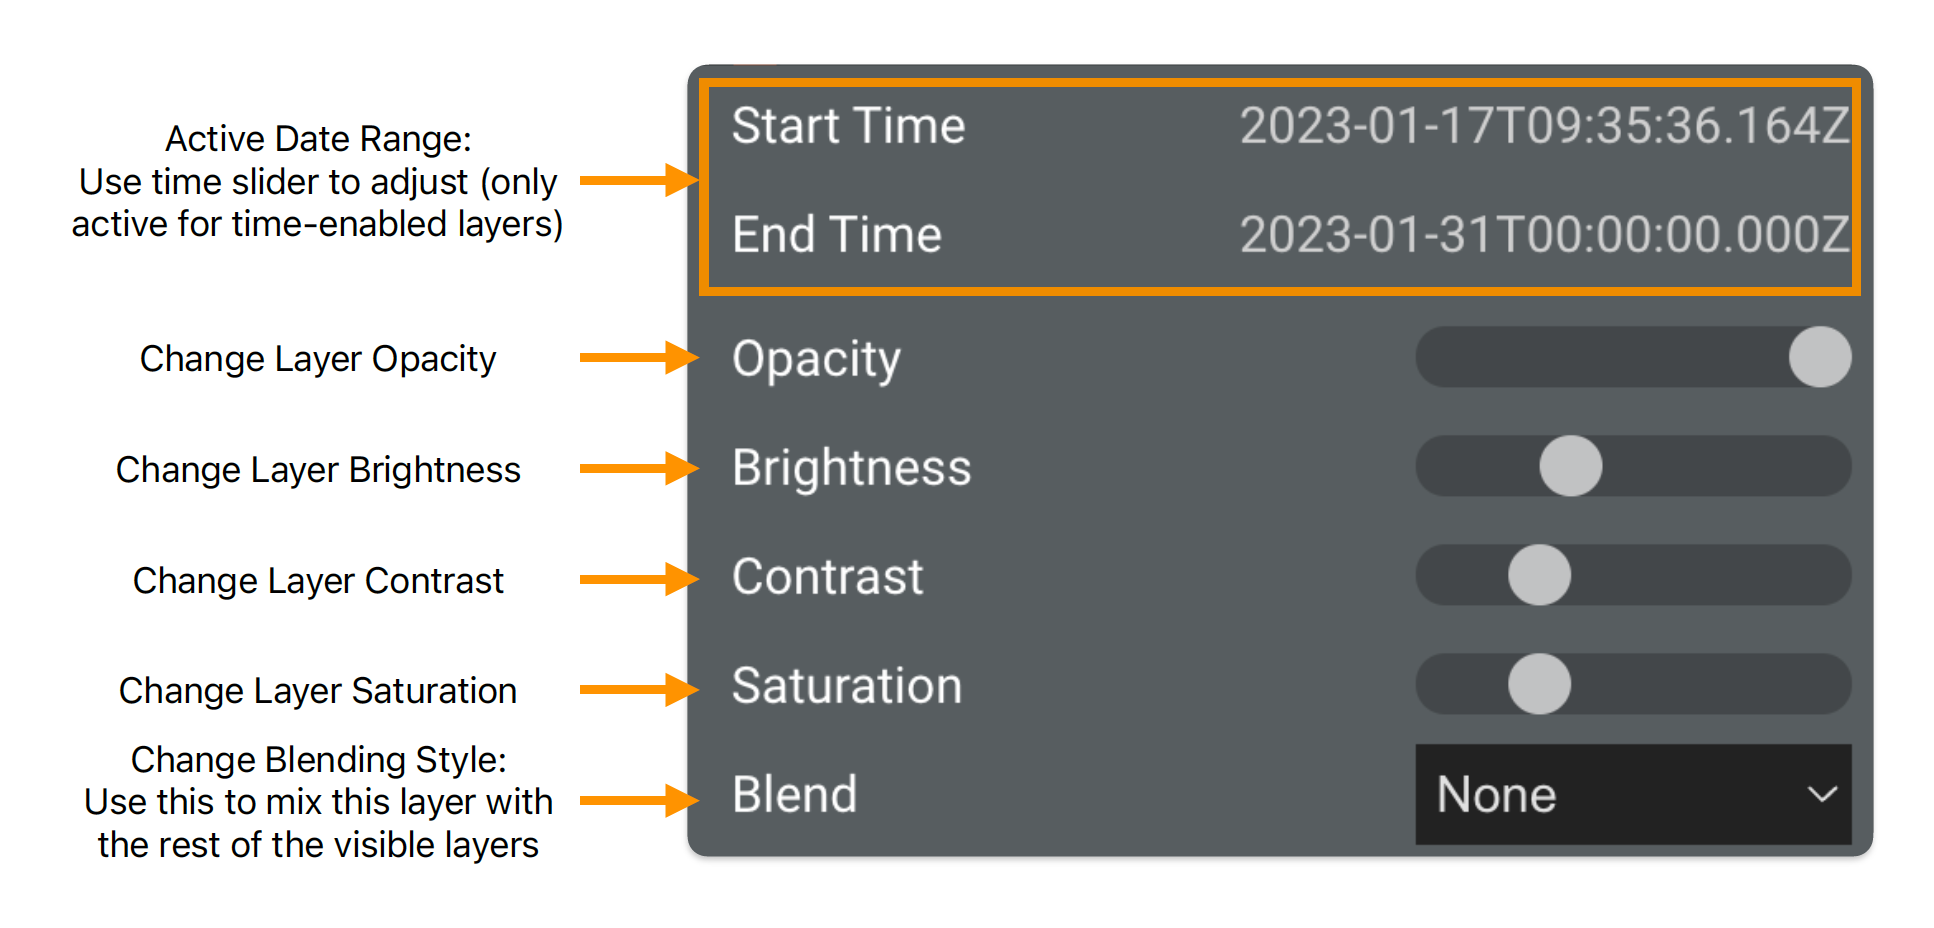
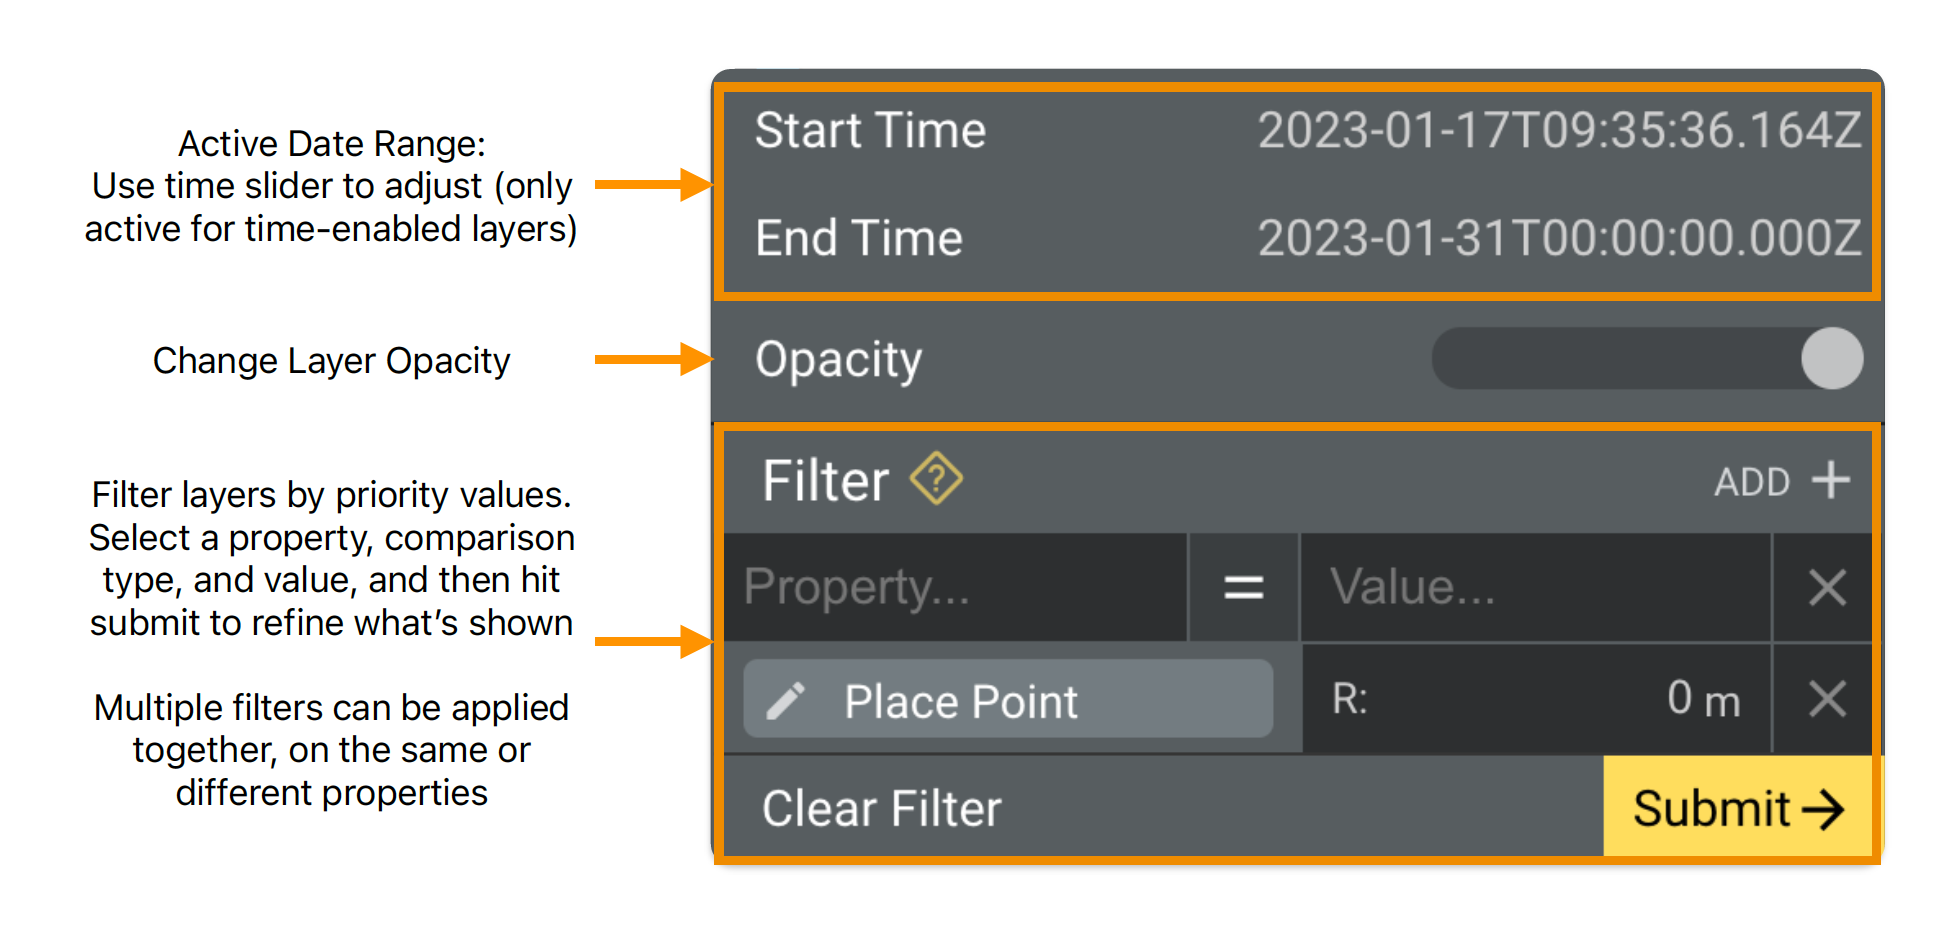
There are two types of layers: rasters (red indicator), and vectors (blue indicator), each with different settings:

Rasters:

rasters

(PDF)

Vectors:

vector info

(PDF)

Information Tool

Use the information tool to click on vectors and get detailed information.

Site List

Use the site list to navigate to different highlighted locations.
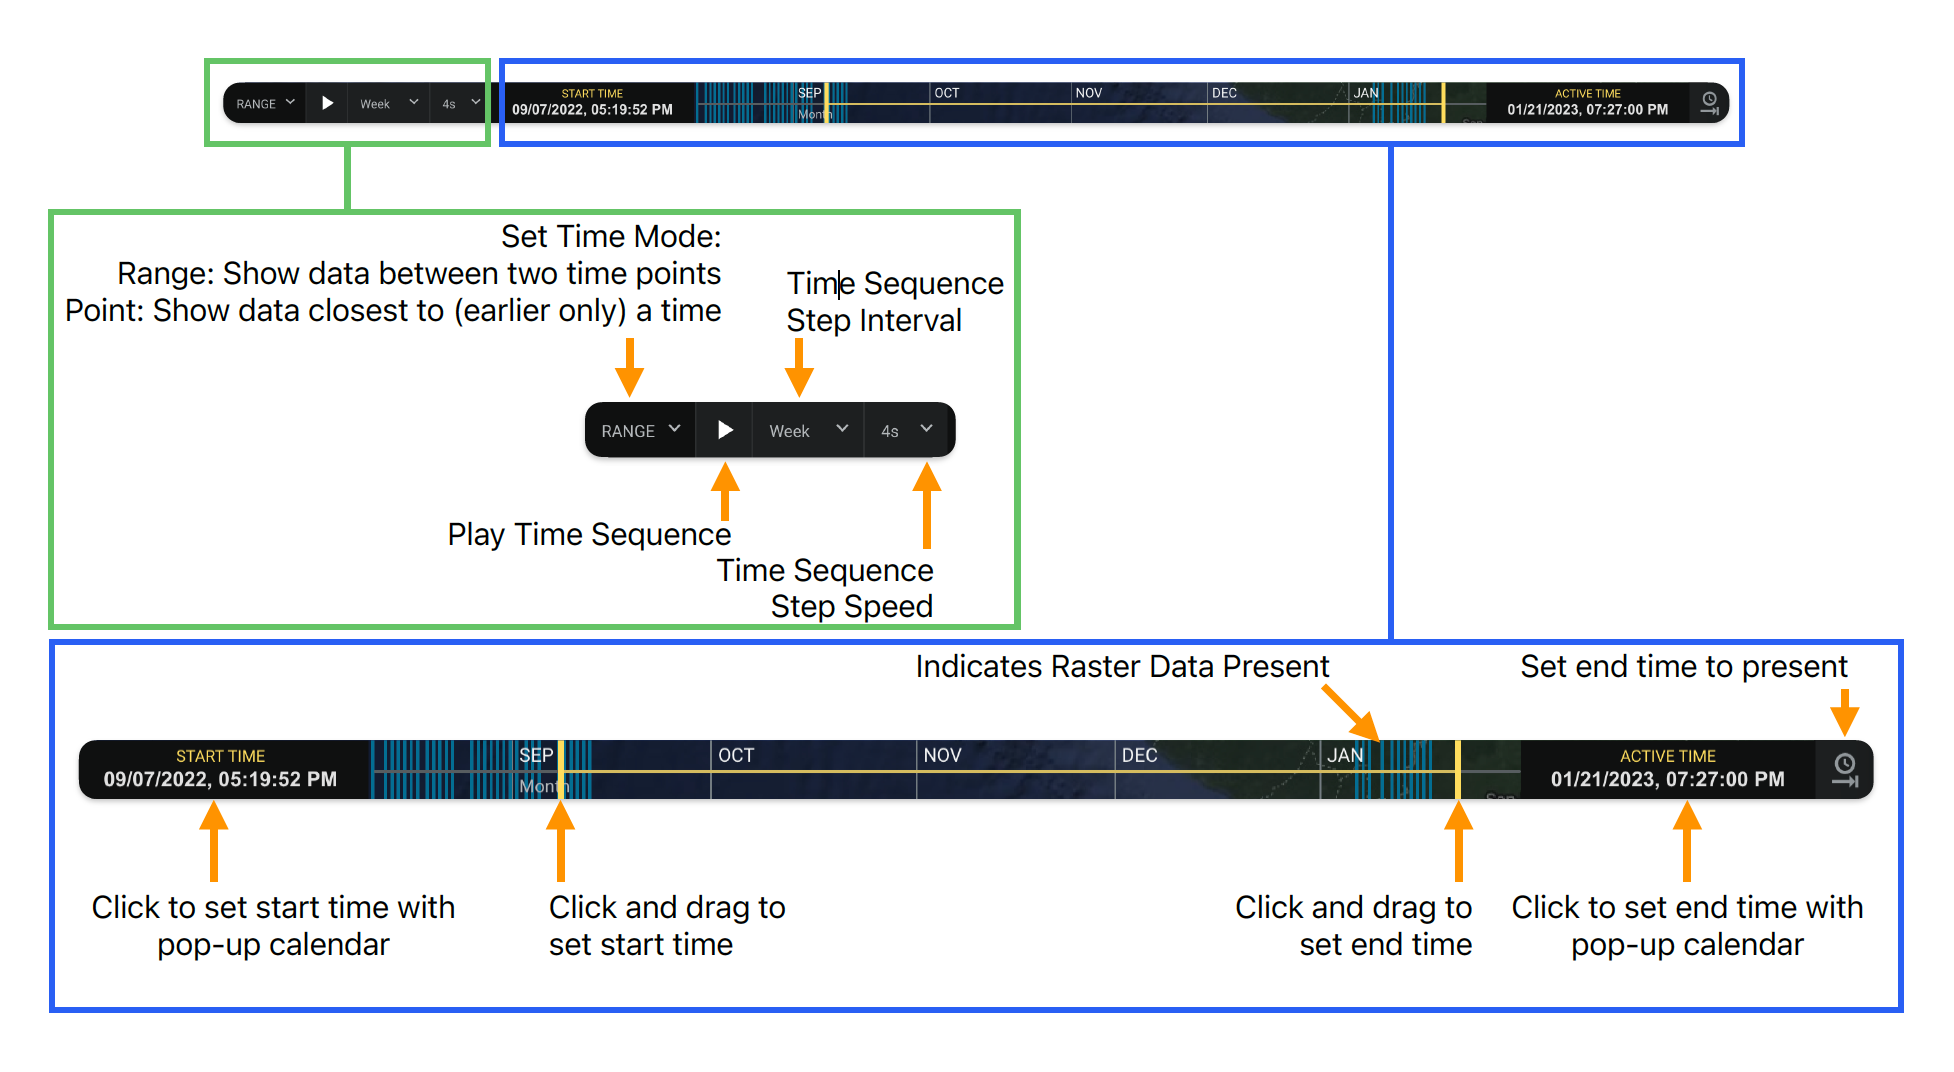
Time Slider

The time slider allows you to filter what is shown on the map based on time.

time slider

(PDF)

Map Details

This map has multiple layer sets, and it can be useful to use them in different combinations. Here are our prebuilt sections, though any combination of layers together may be used:

Coverage and Operations

Coverage - A layer showing approximate tracks for all EMIT data collected to date. Click on tiles and use the information tool to get details about each scene. When a tile is selected, a download link will appear on the top of the screen, which will redirect you to the LP DAAC for direct access of the data. Time slider enabled.

RGB Mosaic - Visible wavelengths from the calibrated EMIT radiance. EMIT data are collected seamlessly in the pushbroom style, each scene is scaled independently to highlight surface features.

Latest Forecast - The predicted 2-week forecast for future EMIT coverage. While useful for planning, the forecast is not exact, and can vary in the crosstrack dimension some 15km, particularly farther out in the forecast. Actual acquisitions are subject to cloud conditions and operational constraints. New forecasts are published weekly, usually on Tuesday.

Mission Products

EMIT Mineralogy - Coming soon! Spectral abundance of dominant earth minerals.

Greenhouse Gases

Methane Plumes - Estimates of methane plume concentrations from point-source emitters, in units of parts per million meters. Methane is identified with open-source code, and potential plumes are manually inspected. Only high-confidence instances are posted to VISIONS. While RGB data is made available rapidly, plumes will not be posted immediately given the need for manual inspection of results.

Plume Information - A metadata layer showing basic information about each identified methane plume.

Methane Tiles - A vector layer outlining tiles that contain methane plumes, to make them easy to find.

Other Applications

Check back soon! Our list of applications is growing.

Frequently Asked Questions

  • What GHGs (Greenhouse Gases) does EMIT see?

    EMIT can detect high concentrations of carbon dioxide and methane, the two dominant greenhouse gases that contribute to climate change. While both of these gasses are invisible to the human eye, methane and carbon dioxide have distinct spectral fingerprints in the shortwave infrared (1900-2500nm) that permit mapping of point source greenhouse gas emissions with EMIT data.

  • Why is it useful to locate high concentrations of these gasses?

    Methane traps more heat in the atmosphere per molecule than carbon dioxide, so targeting reductions in anthropogenic methane emissions offers an effective approach to decrease overall atmospheric warming. Identifying strong emission sources offers the potential to improve our understanding of anthropogenic emissions and to mitigate those emissions. For example, oil & gas operators can locate and fix leaks that are both expensive and environmentally damaging, providing a win-win opportunity. Other sectors could use this information to identify opportunities for methane capture for either flaring or conversion to fuel resources.

  • What information do you provide about a plume complex's location?

    The red circles shown to draw attention to each plume complex are placed at the center point of the bounding box of the complex - this location is not intended to identify the methane source.  In the metadata (see the information tab) we also provide the latitude and longitude of the location of maximum concentration within the complex. 

  • What are the units of these detections?

    The observations that are provided by EMIT through this portal are maps of atmospheric methane enhancements in units of parts per million meter (ppm m). We are not attributing sources to any entities or estimating emission rates from the data presented here. We do, however, provide an estimate of the integrated mass enhancement (kg), which represents the sum of all enhancements within the identified plume complex.

  • How are plume complexes identified?

    The methane enhancements identified in the portal above are a research-grade product that our team has a high confidence in. The core of the retrieval approach is the matched filter (see references in the peer-review question below as well as our algorithm theoretical basis document!), a statistical technique that is commonly used to isolate subtle signatures from within a spectrum. To help ensure that we only show real methane enhancements, the matched filter results are manually scanned, and plume complexes are identified and confirmed by scientists prior to posting.  This helps remove any artifacts from the retrieval process.  However, because the process involves a manual step, it is possible that some plumes might have been missed.  As we continue to refine and automate our procedure, more and more plume complexes will appear.  We also err on the side of being conservative - if an enhancement is difficult to distinguish from background noise, it is not included in the portal.

  • How long after EMIT observes a plume will it be posted here?

    After EMIT makes an observation the data are stored on a drive in the instrument on the International Space Station. Data are continuously transmitted from the ISS, but because we collect data only when the sun is well aligned with the instrument, the amount of data being collected on any given day can vary widely based on the current location of the ISS in its orbit. This variability in the amount of data being collected means that sometimes data is collected much faster than the limited transmission capacity can keep up with, meaning that a particular scene can be received anywhere from hours to seven days after observation.  Once they are back on Earth, data are then transferred to JPL, and analyzed for methane enhancement detection. The automated processing typically completes within several hours, but to ensure the highest quality of plume complex identification, a scientist reviews each detected plume before it is loaded onto this platform, which can take up to several days. Plumes identified by the EMIT team will be posted as soon as they are identified and confirmed by scientists.

  • Are the methods used by the EMIT team peer reviewed?

    Yes, the imaging spectroscopy team at JPL along with university colleagues has a decades long track record detecting and measuring GHG point sources with imaging spectrometers like EMIT. Additional information on methane retrievals in particular can be found here, along with the User Guide here, and algorithm theoretical basis document here.

    . The code used to generate these datasets is open source, and available here. There are a variety of tutorials for working with EMIT data here, and one for completing match filter analysis for methane detection is currently in development.

    References for key advances and validation with NASA imaging spectroscopy:

    • Roberts, D.A., Bradley, E.S., Cheung, R., Leifer, I., Dennison, P.E. and Margolis, J.S., 2010. Mapping methane emissions from a marine geological seep source using imaging spectrometry. Remote Sensing of Environment, 114(3), pp.592-606.

    • Thorpe, A.K., Roberts, D.A., Dennison, P.E., Bradley, E.S., Funk, C.C. (2012). Point source emissions mapping using the Airborne Visible/Infrared Imaging Spectrometer (AVIRIS). Proc. SPIE, 8390, 839013.

    • Dennison, P.E., Thorpe, A.K., Qi, Y., Roberts, D.A., Green, R.O., Bradley, E.S., Funk, C.C. (2013). High spatial resolution mapping of elevated atmospheric carbon dioxide using airborne imaging spectroscopy: Radiative transfer modeling and power plant plume detection. Remote Sensing of Environment, 139, 116–129.

    • Thompson, D.R., Leifer, I., Bovensmann, H., Eastwood, M.L., Green, R.O., Eastwood, M.L., Fladeland, M., Frankenberg, C., Gerilowski, K., Green, R.O., Kratwurst, S., Krings, T., Luna, B., Thorpe, A.K. (2015). Real time remote detection and measurement for airborne imaging spectroscopy: A case study with methane. Atmospheric Measurement Techniques, 8, 4383-4397.

    • Frankenberg, C., Thorpe, A.K., Thompson, D.R., Hulley, G., Kort, E.A., Vance, N., Borchardt, J., Krings, T., Gerilowski, K., Sweeney, C., Conley, S. (2016). Airborne methane remote measurements reveal heavy-tail flux distribution in Four Corners region. Proceedings of the National Academy of Sciences, 201605617.

    • Thorpe, A.K., Frankenberg, C., Roberts, et al. (2016). Mapping methane concentrations from a controlled release experiment using the next generation Airborne Visible/Infrared Imaging Spectrometer (AVIRIS-NG). Remote Sensing of Environment, 179, 104-115.

    • Duren, R.M., Thorpe, A.K., Foster, K., Rafiq, T., Hopkins, F.M., Yadav, V., Bue, B.D., Conley, S., Colombi, N., McCubbin, I., Frankenberg, C., Thompson, D.R., Falk, M., Herner, J., Croes, B., Green, R.O., Miller, C.E. (2019). California’s methane super-emitters. Nature.

    • Cusworth, Daniel H., Andrew K. Thorpe, Alana K. Ayasse, David Stepp, Joseph Heckler, Gregory P. Asner, Charles E. Miller et al. "Strong methane point sources contribute a disproportionate fraction of total emissions across multiple basins in the United States." Proceedings of the National Academy 

    Detection of a point source methane super emitter from space was first done with the NASA Hyperion imaging spectrometer.

    • Thompson, D.R., Thorpe, A.K., Frankenberg, C., Green, R.O., Duren, R., Guanter, L., Hollstein, A., Middleton, E., Ong, L., Ungar, S. (2016). Space‐based remote imaging spectroscopy of the Aliso Canyon CH4 super-emitter. Geophysical Research Letters, 43(12), 6571-6578.

  • I have a question that isn't listed here?

    Any other questions can be submitted here.


Engineers and scientists created this experience based on MMGIS - a free and open source geospatial application created by NASA AMMOS for planetary science mission operations, like deciding where the Perseverance rover will explore on the surface of Mars. We have integrated this tool into the EMIT Science Data System to present a framework we call VISIONS: the VSWIR Imaging Spectroscopy Interface for Open Science.