This portal shows EMIT data coverage to-date and forecasts of future acquisitions (updated daily). Each scene contains links to data available for download from the LP DAAC. See Map Details for information on what you can explore.

Using the Map

Scroll and pan around this map to see the latest coverage and data products. Key features are shown below with details broken out in sections.

Feature Overview

mmgis portal instructions

(PDF)

Layer Tool

Multiple data layers are available for viewing, and can be toggled on and off:

layerinfo

(PDF)

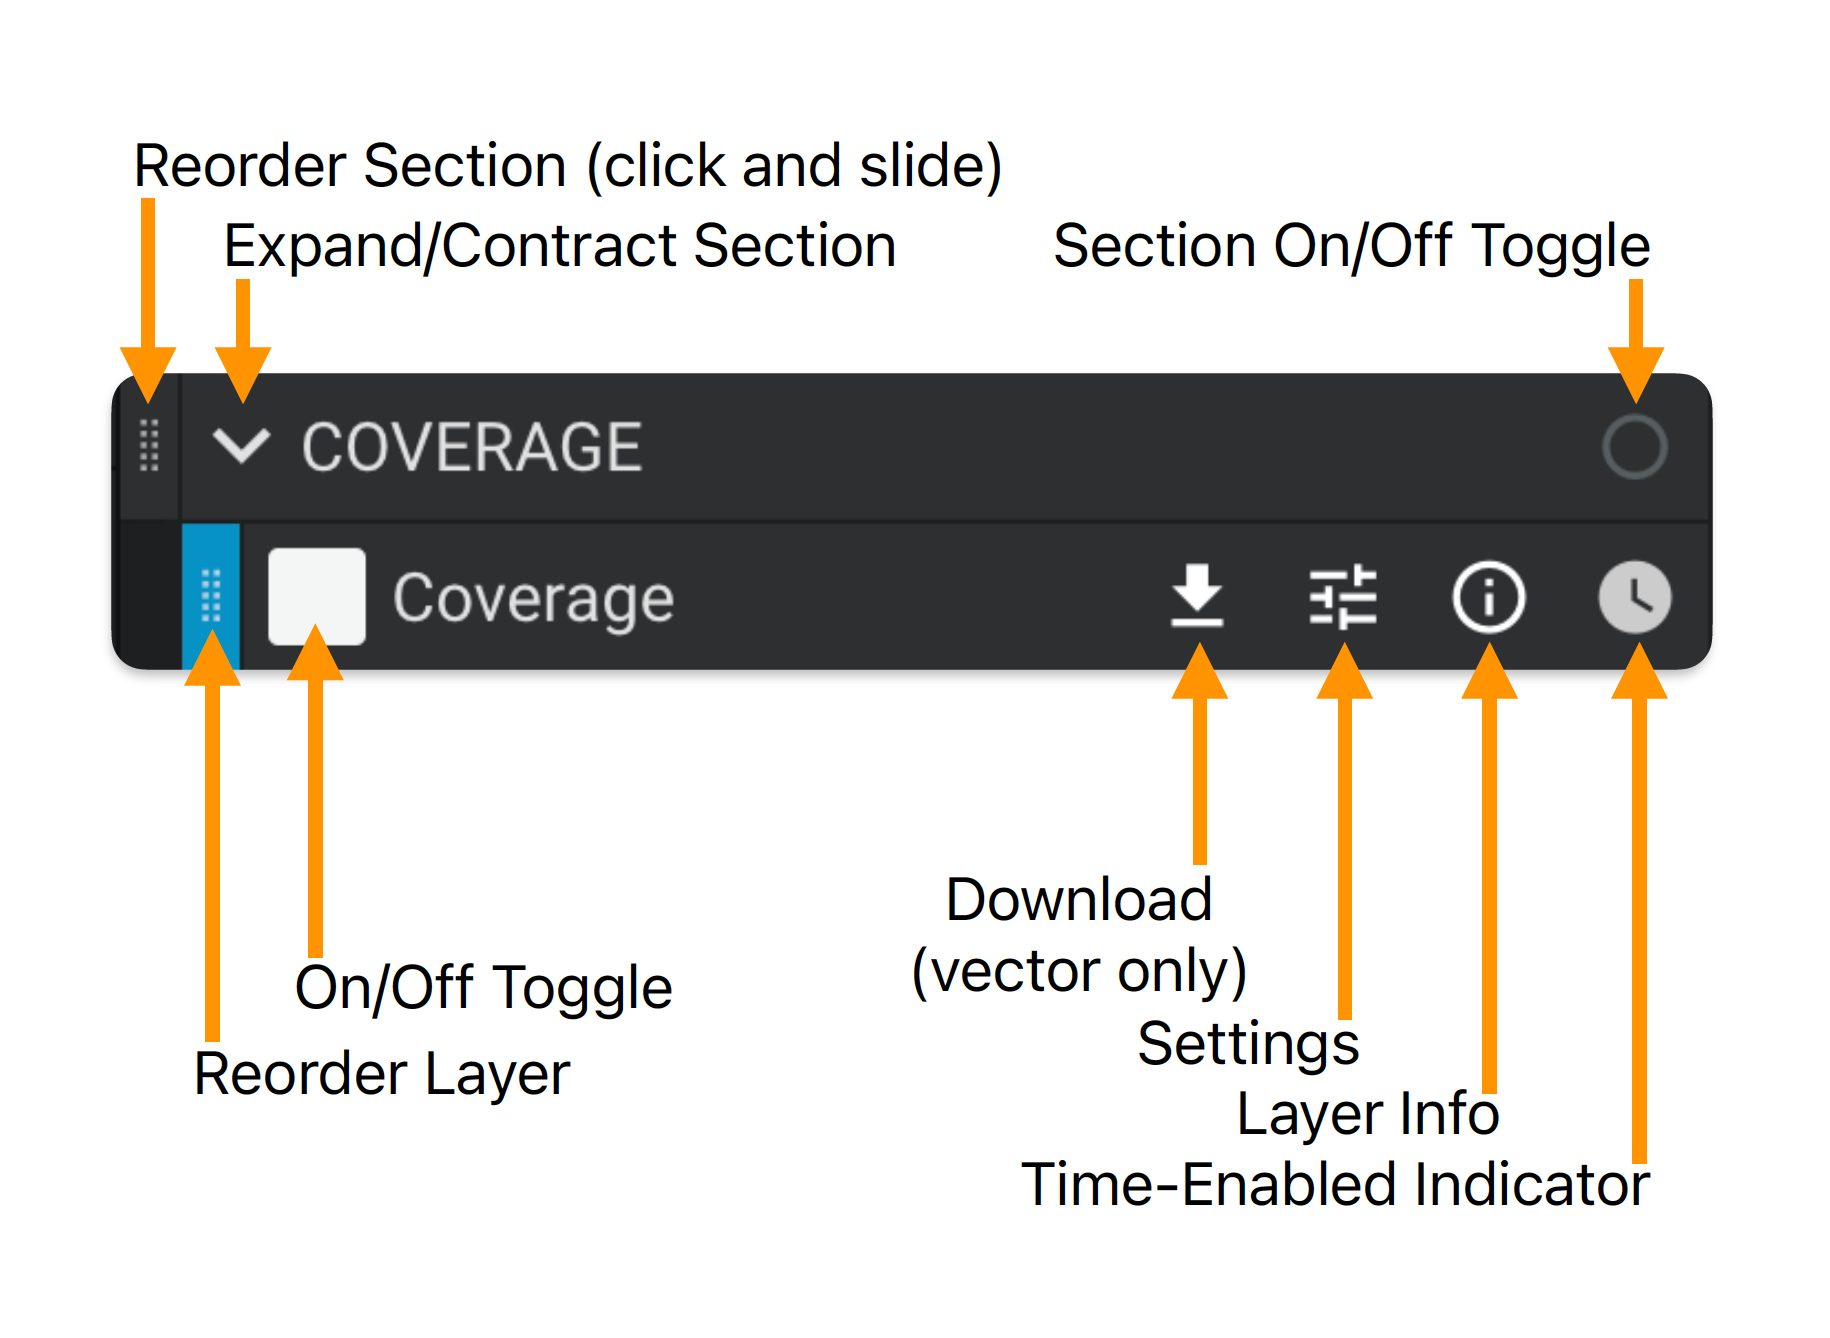
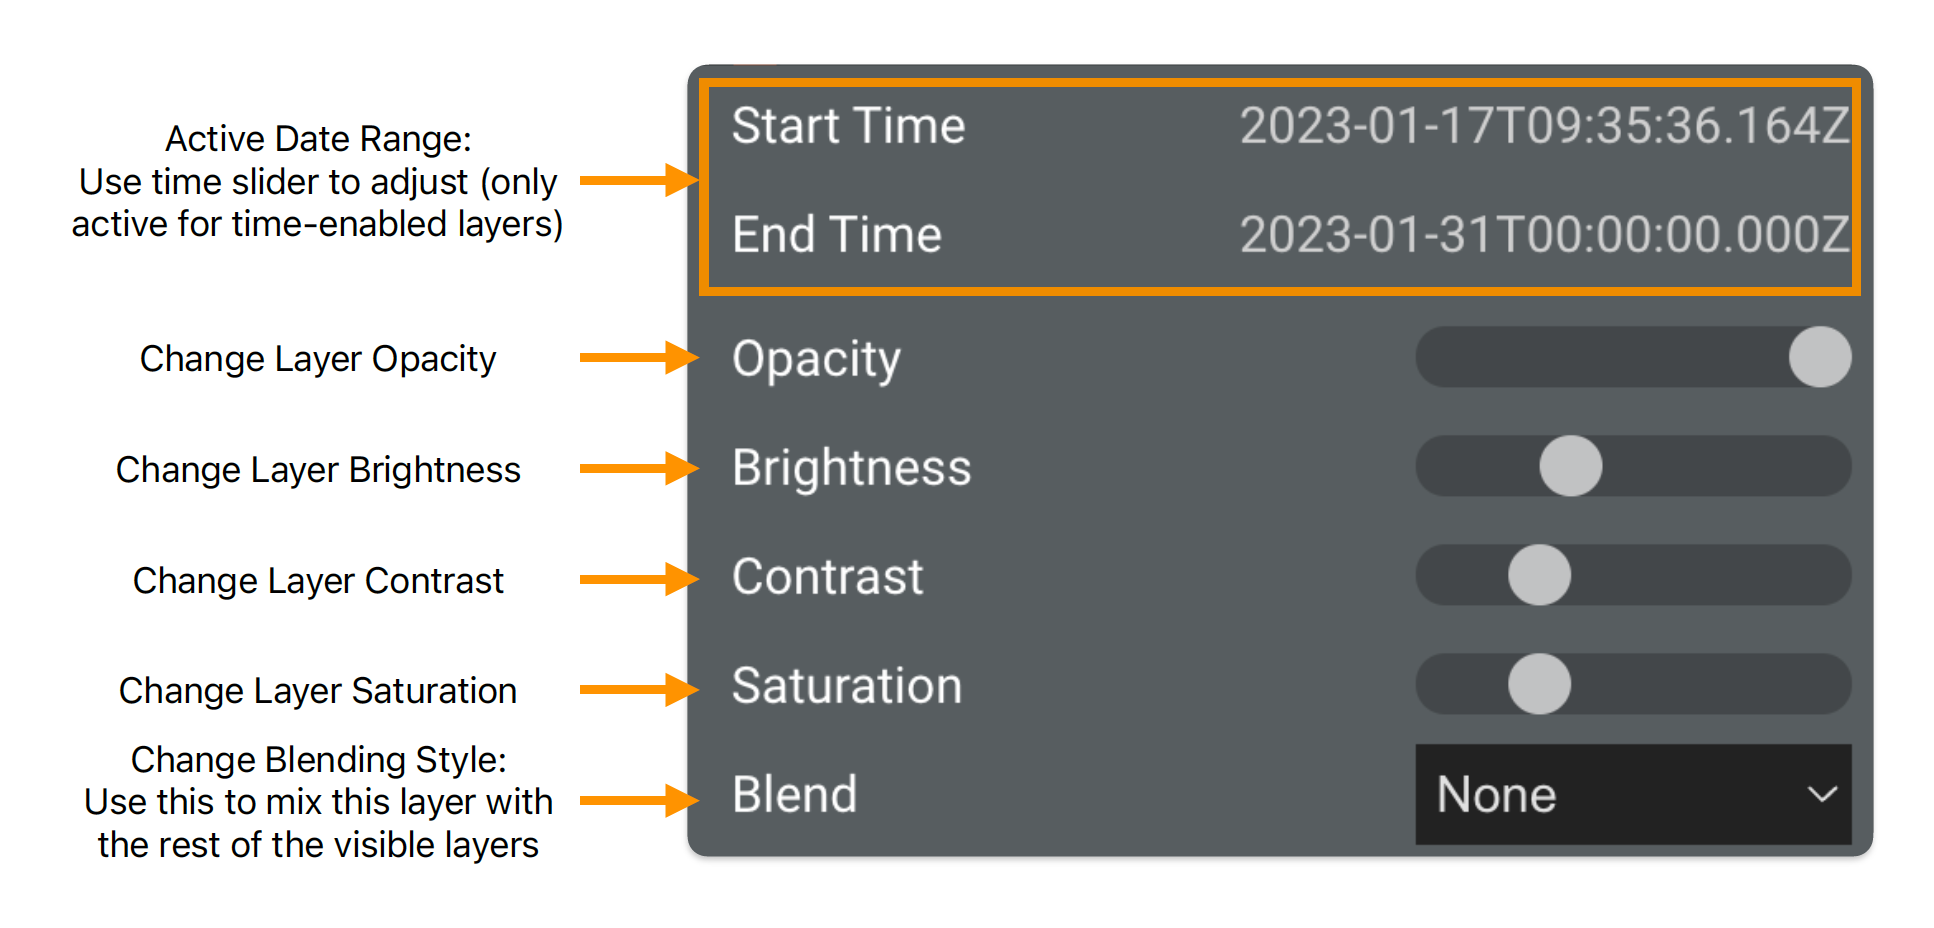
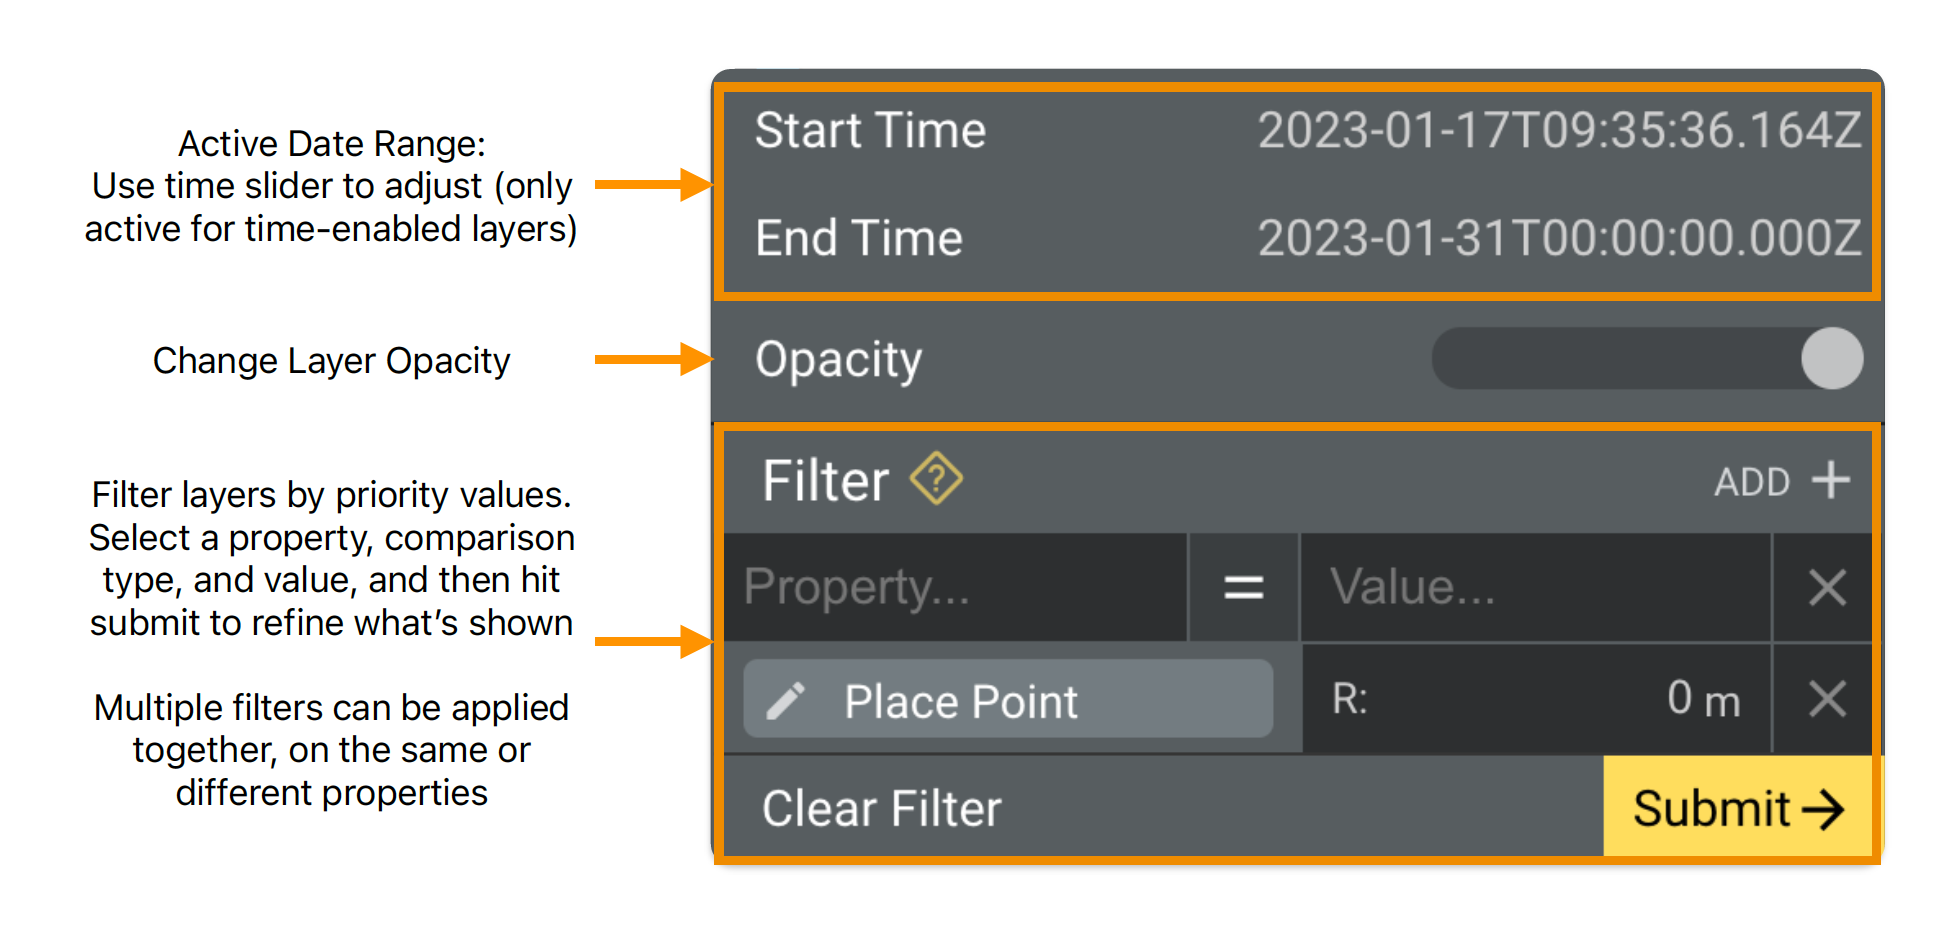
There are two types of layers: rasters (red indicator), and vectors (blue indicator), each with different settings:

Rasters:

rasters

(PDF)

Vectors:

vector info

(PDF)

Information Tool

Use the information tool to click on vectors and get detailed information.

Site List

Use the site list to navigate to different highlighted locations.
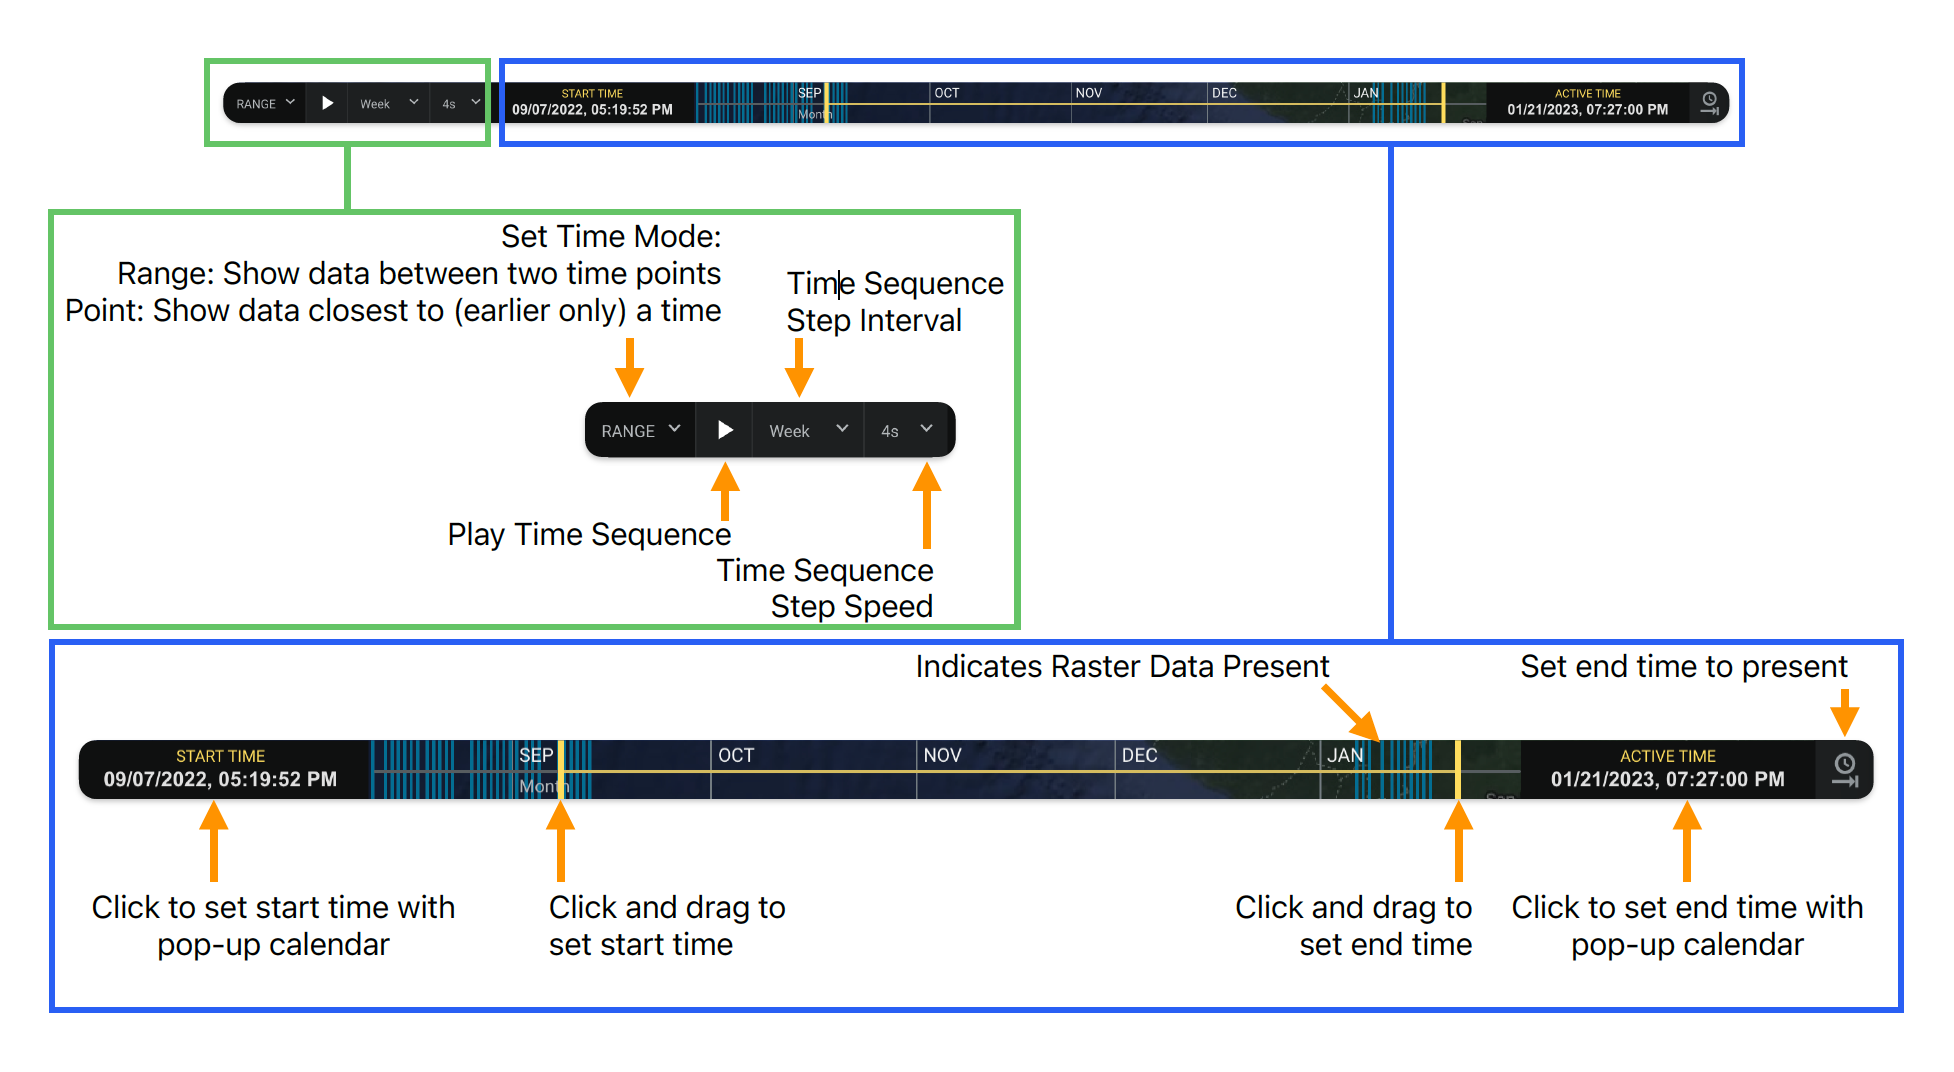
Time Slider

The time slider allows you to filter what is shown on the map based on time.

time slider

(PDF)

Map Details

This map has multiple layer sets, and it can be useful to use them in different combinations. Here are our prebuilt sections, though any combination of layers together may be used:

Coverage and Operations

Coverage - A layer showing approximate tracks for all EMIT data collected to date. Click on tiles and use the information tool to get details about each scene. When a tile is selected, a download link will appear on the top of the screen, which will redirect you to the LP DAAC for direct access of the data. Time slider enabled.

RGB Mosaic - Visible wavelengths from the calibrated EMIT radiance. EMIT data are collected seamlessly in the pushbroom style, each scene is scaled independently to highlight surface features.

Latest Forecast - The predicted 2-week forecast for future EMIT coverage. While useful for planning, the forecast is not exact, and can vary in the crosstrack dimension some 15km, particularly farther out in the forecast. Actual acquisitions are subject to cloud conditions and operational constraints. New forecasts are published weekly, usually on Tuesday.

Mission Products

EMIT Mineralogy - Coming soon! Spectral abundance of dominant earth minerals.

Greenhouse Gases

Methane Plumes - Estimates of methane plume concentrations from point-source emitters, in units of parts per million meters. Methane is identified with open-source code, and potential plumes are manually inspected. Only high confidence instances are posted to VISIONS. While RGB data is made available rapidly, plumes will not be posted immediately given the need for manual inspection of results.

Plume Information - A metadata layer showing basic information about each identified methane plume.

Methane Tiles - A vector layer outlining tiles that contain methane plumes, to make them easy to find.

Other Applications

Check back soon! Our list of applications is growing.

Frequently Asked Questions

  • How often are data updated on this portal?

    Many factors determine how quickly data can be downloaded from the International Space Station and transferred to our processing facilities, but typically this process takes between 1 and 7 days.  After this, data are processed in as little as a few hours, and made available within a day to this portal.  Data transfer to the LP DAAC may take some additional time, especially in the early phase of the mission.

  • Will EMIT collect data everywhere I see a forecast?

    Forecasts show the planned acquisitions for EMIT, but some locations will not have data recorded.  This generally occurs when EMIT’s on-board cloud screener identifies large clouds and filters out these data before they are transmitted down. However, other operational factors can cause interruptions.

  • How accurate is EMIT’s forecasted coverage?

    The downtrack (the long direction) accuracy is relatively high, usually within about 25 km.  The crosstrack (the short direction) accuracy is typically within 15 km.  The accuracy tends to degrade the farther out in time it is, meaning individuals planning fieldwork should check back in regularly for the latest forecast, and try to aim for the middle of a line.  Forecasts are updated weekly, usually by Wednesday morning, and extend for two weeks.

  • Can I download the data?

    Absolutely!  EMIT data are hosted on the LP DAAC, and currently radiance and reflectance data are available to download. If you click on a coverage tile in the portal, a download link will appear that will redirect you to download the selected tile.  You can also search for data using Earthdata Search.

  • Why are some of the RGB tiles wild colors?

    We stretch each scene individually in order to highlight diverse surface features, starting from the observed radiance data.  Sometimes anomalies in the data or particular surface features can make these stretches look quite astonishing, but the underlying radiance and reflectance data are still of high quality.

  • Why do I see edges in the RGB data?

    Data from EMIT is collected in a continuous stream; we only break it up into scenes on the ground for convenience, to prevent the need to download massive files. However, we stretch each scene individually to maximize the amount of surface features you can see, which induces an artificial boundary; don’t worry, the underlying data won’t have this effect!

  • Why are there missing stripes in the data?

    EMIT utilizes an on-board cloud screening algorithm to excise thick, dense cloud cover.  The mission does this in order to save download capacity, and most of the missing stripes you see are from heavily clouded areas.  Because our on-board algorithm is very conservative, you will still see plenty of clouds in the imagery however.

  • I have a question that isn't listed here?

    Any other questions can be submitted here.


Engineers and scientists created this experience based on MMGIS - a free and open source geospatial application created by NASA AMMOS for planetary science mission operations, like deciding where the Perseverance rover will explore on the surface of Mars. We have integrated this tool into the EMIT Science Data System to present a framework we call VISIONS: the VSWIR Imaging Spectroscopy Interface for Open Science.