Observing your community can depend greatly on your perspective. A science teacher's dive into local carbon dioxide data provides a point of comparison for what NASA's carbon-monitoring satellite can reveal.
Not far from the Oakland shoreline, where you can catch a dreamy, distant glimpse of the Golden Gate Bridge, is the middle school where Jess Kunz teaches science. It’s in the Fruitvale neighborhood of Oakland: only a fifteen-minute drive away from the shore, but a world apart. Here, the mists of the San Francisco Bay give way to the gas fumes of cars; the blossomy seashore paths give way to pavement, concrete, and dense urban living.
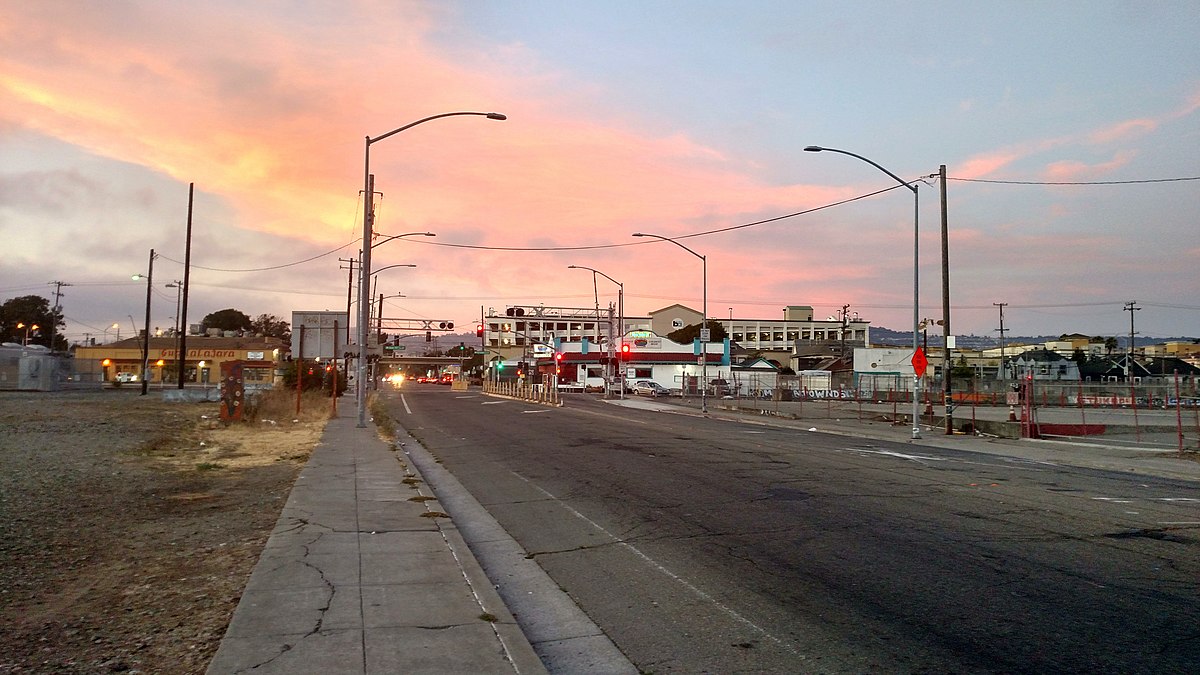
Ever since Jess arrived at her school as a student teacher, she has loved it and sees her job as her life’s work. She strives to connect her science lessons to the community where her students live. So when it came time to teach her class about climate change and air pollution, she chose an example three blocks from the school: the I-880 freeway, its ten lanes loaded with cars and trucks.
Her students were intrigued by the topic of climate change. “It’s an issue affecting the whole world,” a student named Salina volunteered. “And if we don’t do something about it, we will have no future,” another girl, Carolina, chimed in.
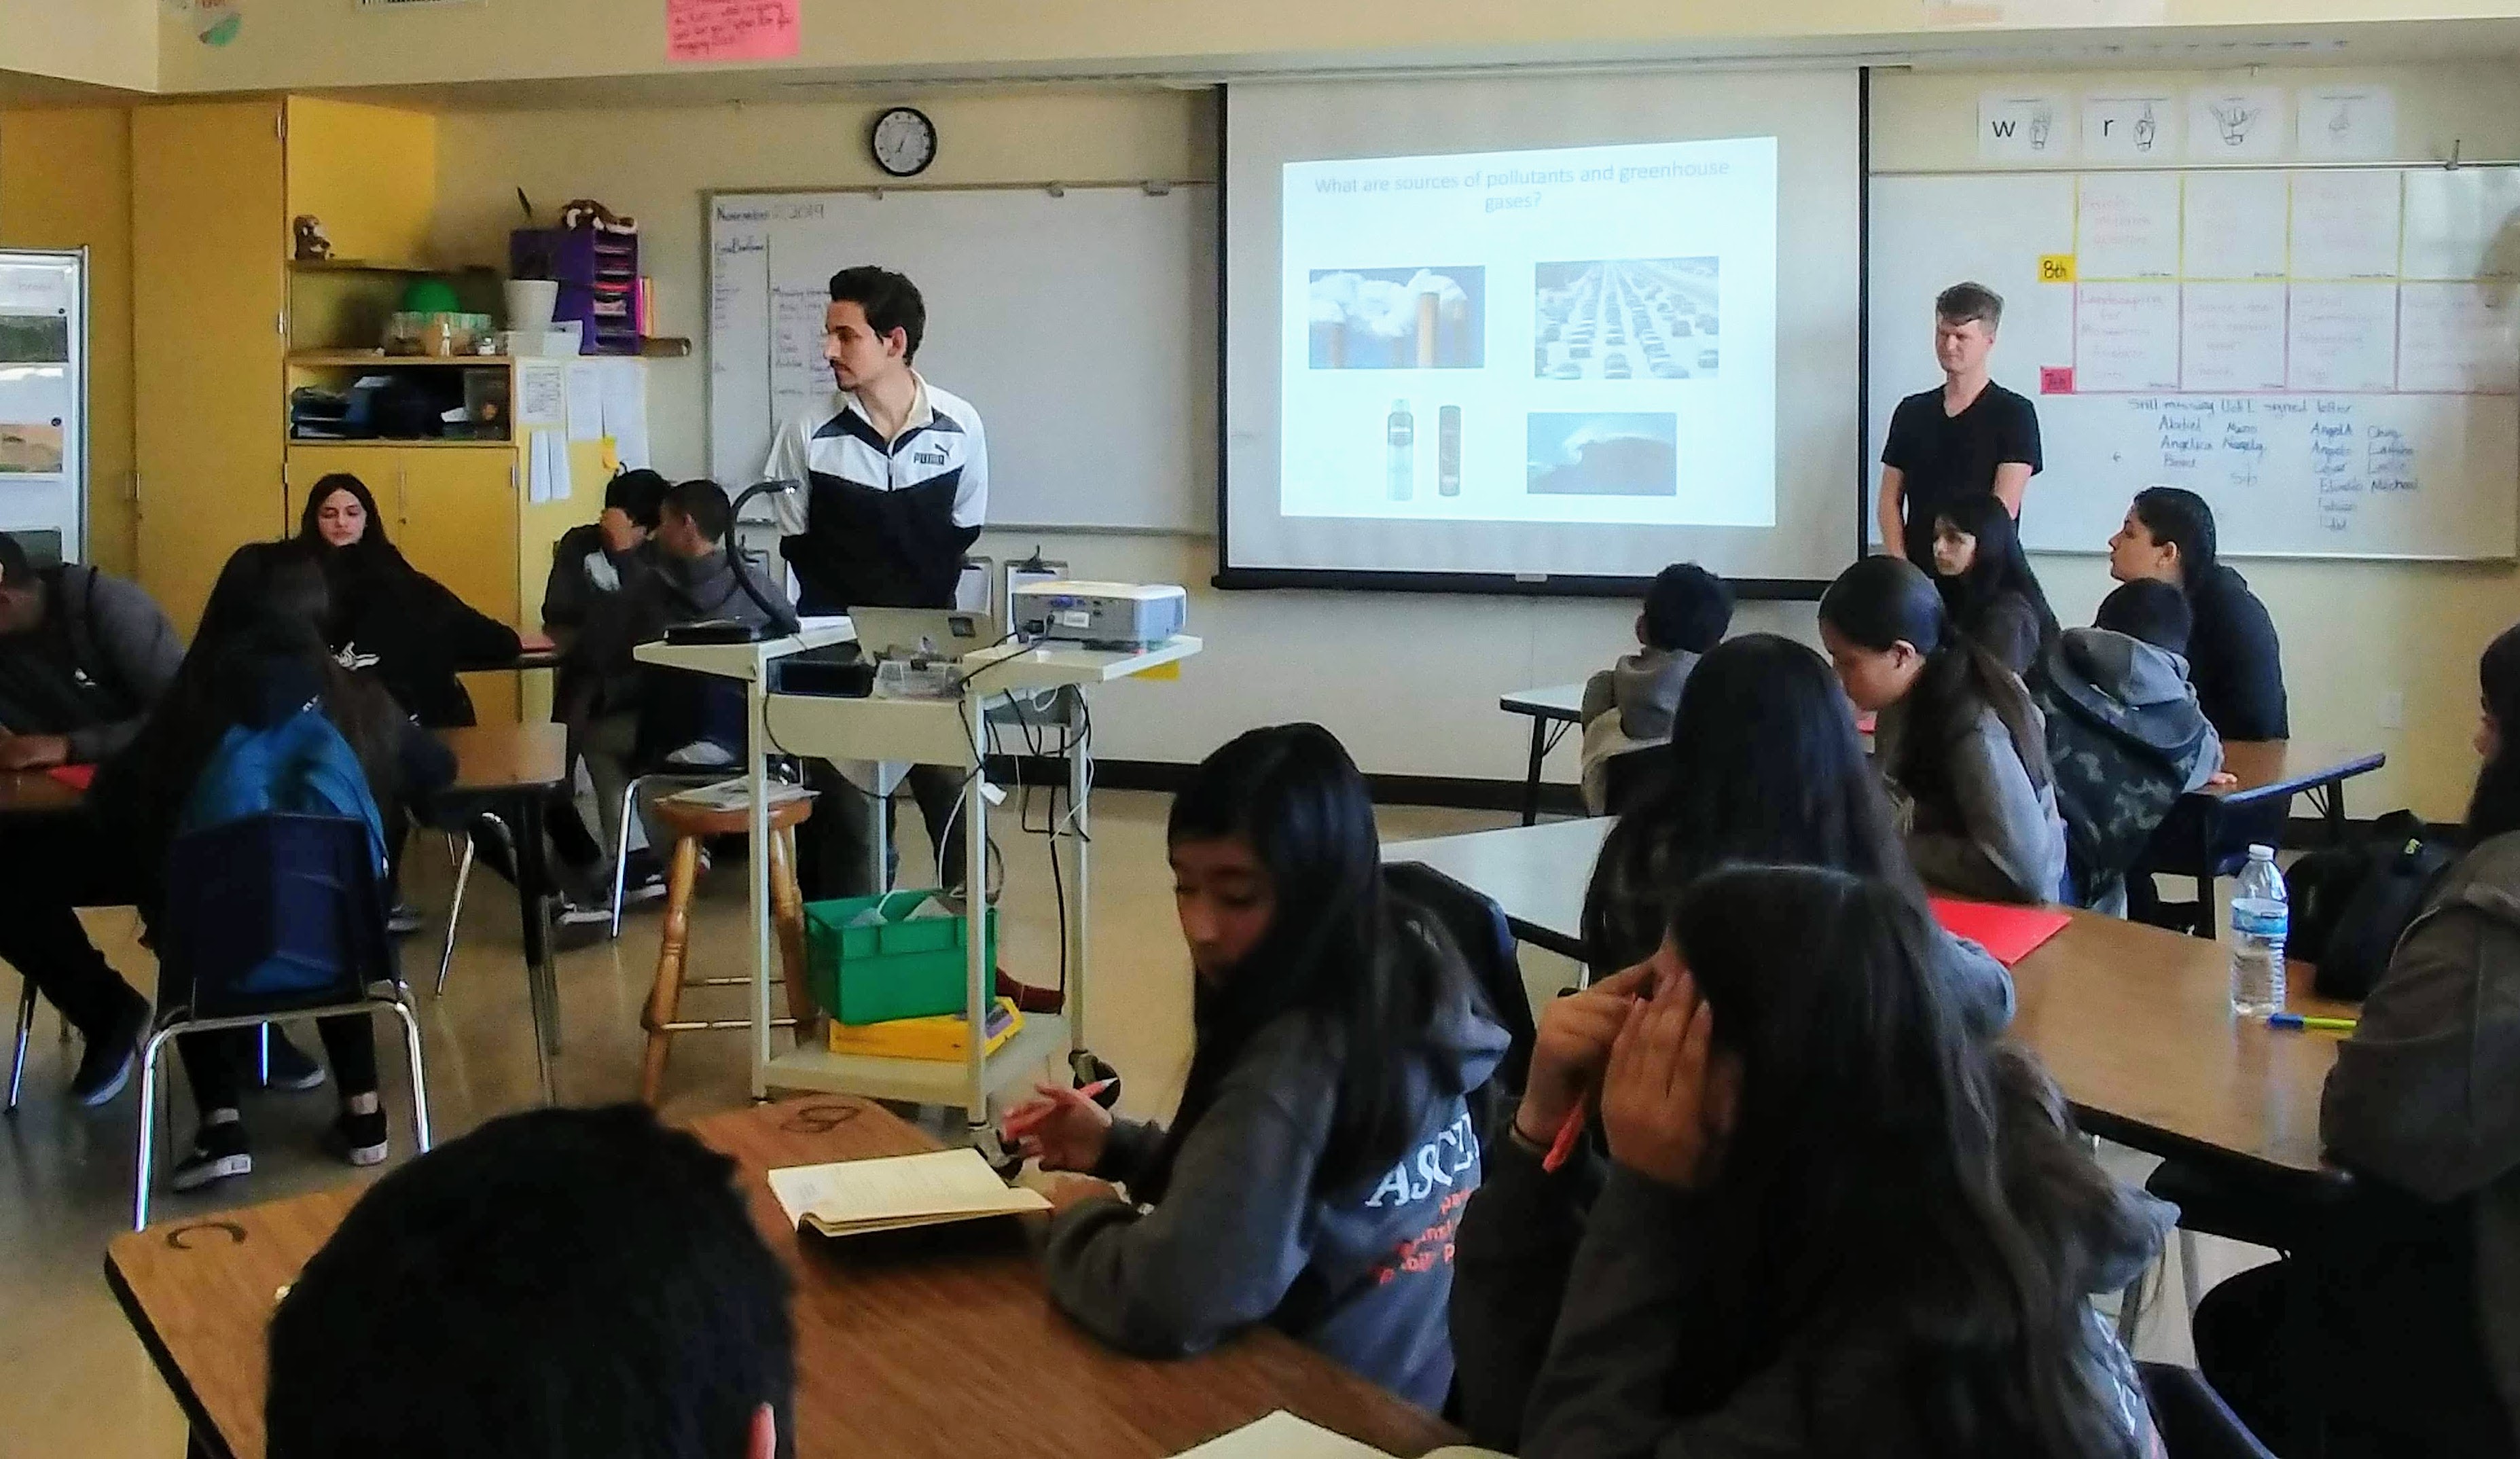
Their interest was heightened even further when Jess introduced data straight from the community for the students to look at. For that, she looked to the University of California, Berkeley, whose leafy green lawns are roughly a 30-minute bike ride from Jess’ Oakland school. A research group there has placed a network of sensors, each the size of a loaf of bread, on 70 rooftops around Berkeley, Oakland, and the surrounding towns. These rooftop sensors measure carbon dioxide and air pollutants, and maps of the data are provided online. It was precisely the sort of authentic data that Jess felt would connect science to her students’ lives.
Not only were the students engrossed by the maps, but something soon stood out to them.
As a student named Jaime put it, “Some of the worst carbon dioxide and air quality in Oakland is near the I-880 freeway because all the big trucks have to go there.” The freeway, which runs through mostly lower-income neighborhoods home to a large immigrant population, is the same one zooming past only three blocks from the students’ school. At the same time, the students also noticed that concentrations of carbon dioxide and air pollution tapered off along the I-580 freeway that runs through higher-income areas where trucks have been banned.

This revelation proved to be a launchpad for further inquiry. Jess’ students learned about the burden of environmental issues falling disproportionately on marginalized communities. They also learned about the health consequences for people living near the freeway. Later, during the school’s community day, they arranged all they’d learned onto posters and shared their new knowledge with visitors. “They’re motivated to teach people about what they’ve learned, and to present data so that visitors can understand it,” Jess said. “It helps them identify with who a scientist is beyond a person in a white lab coat.”
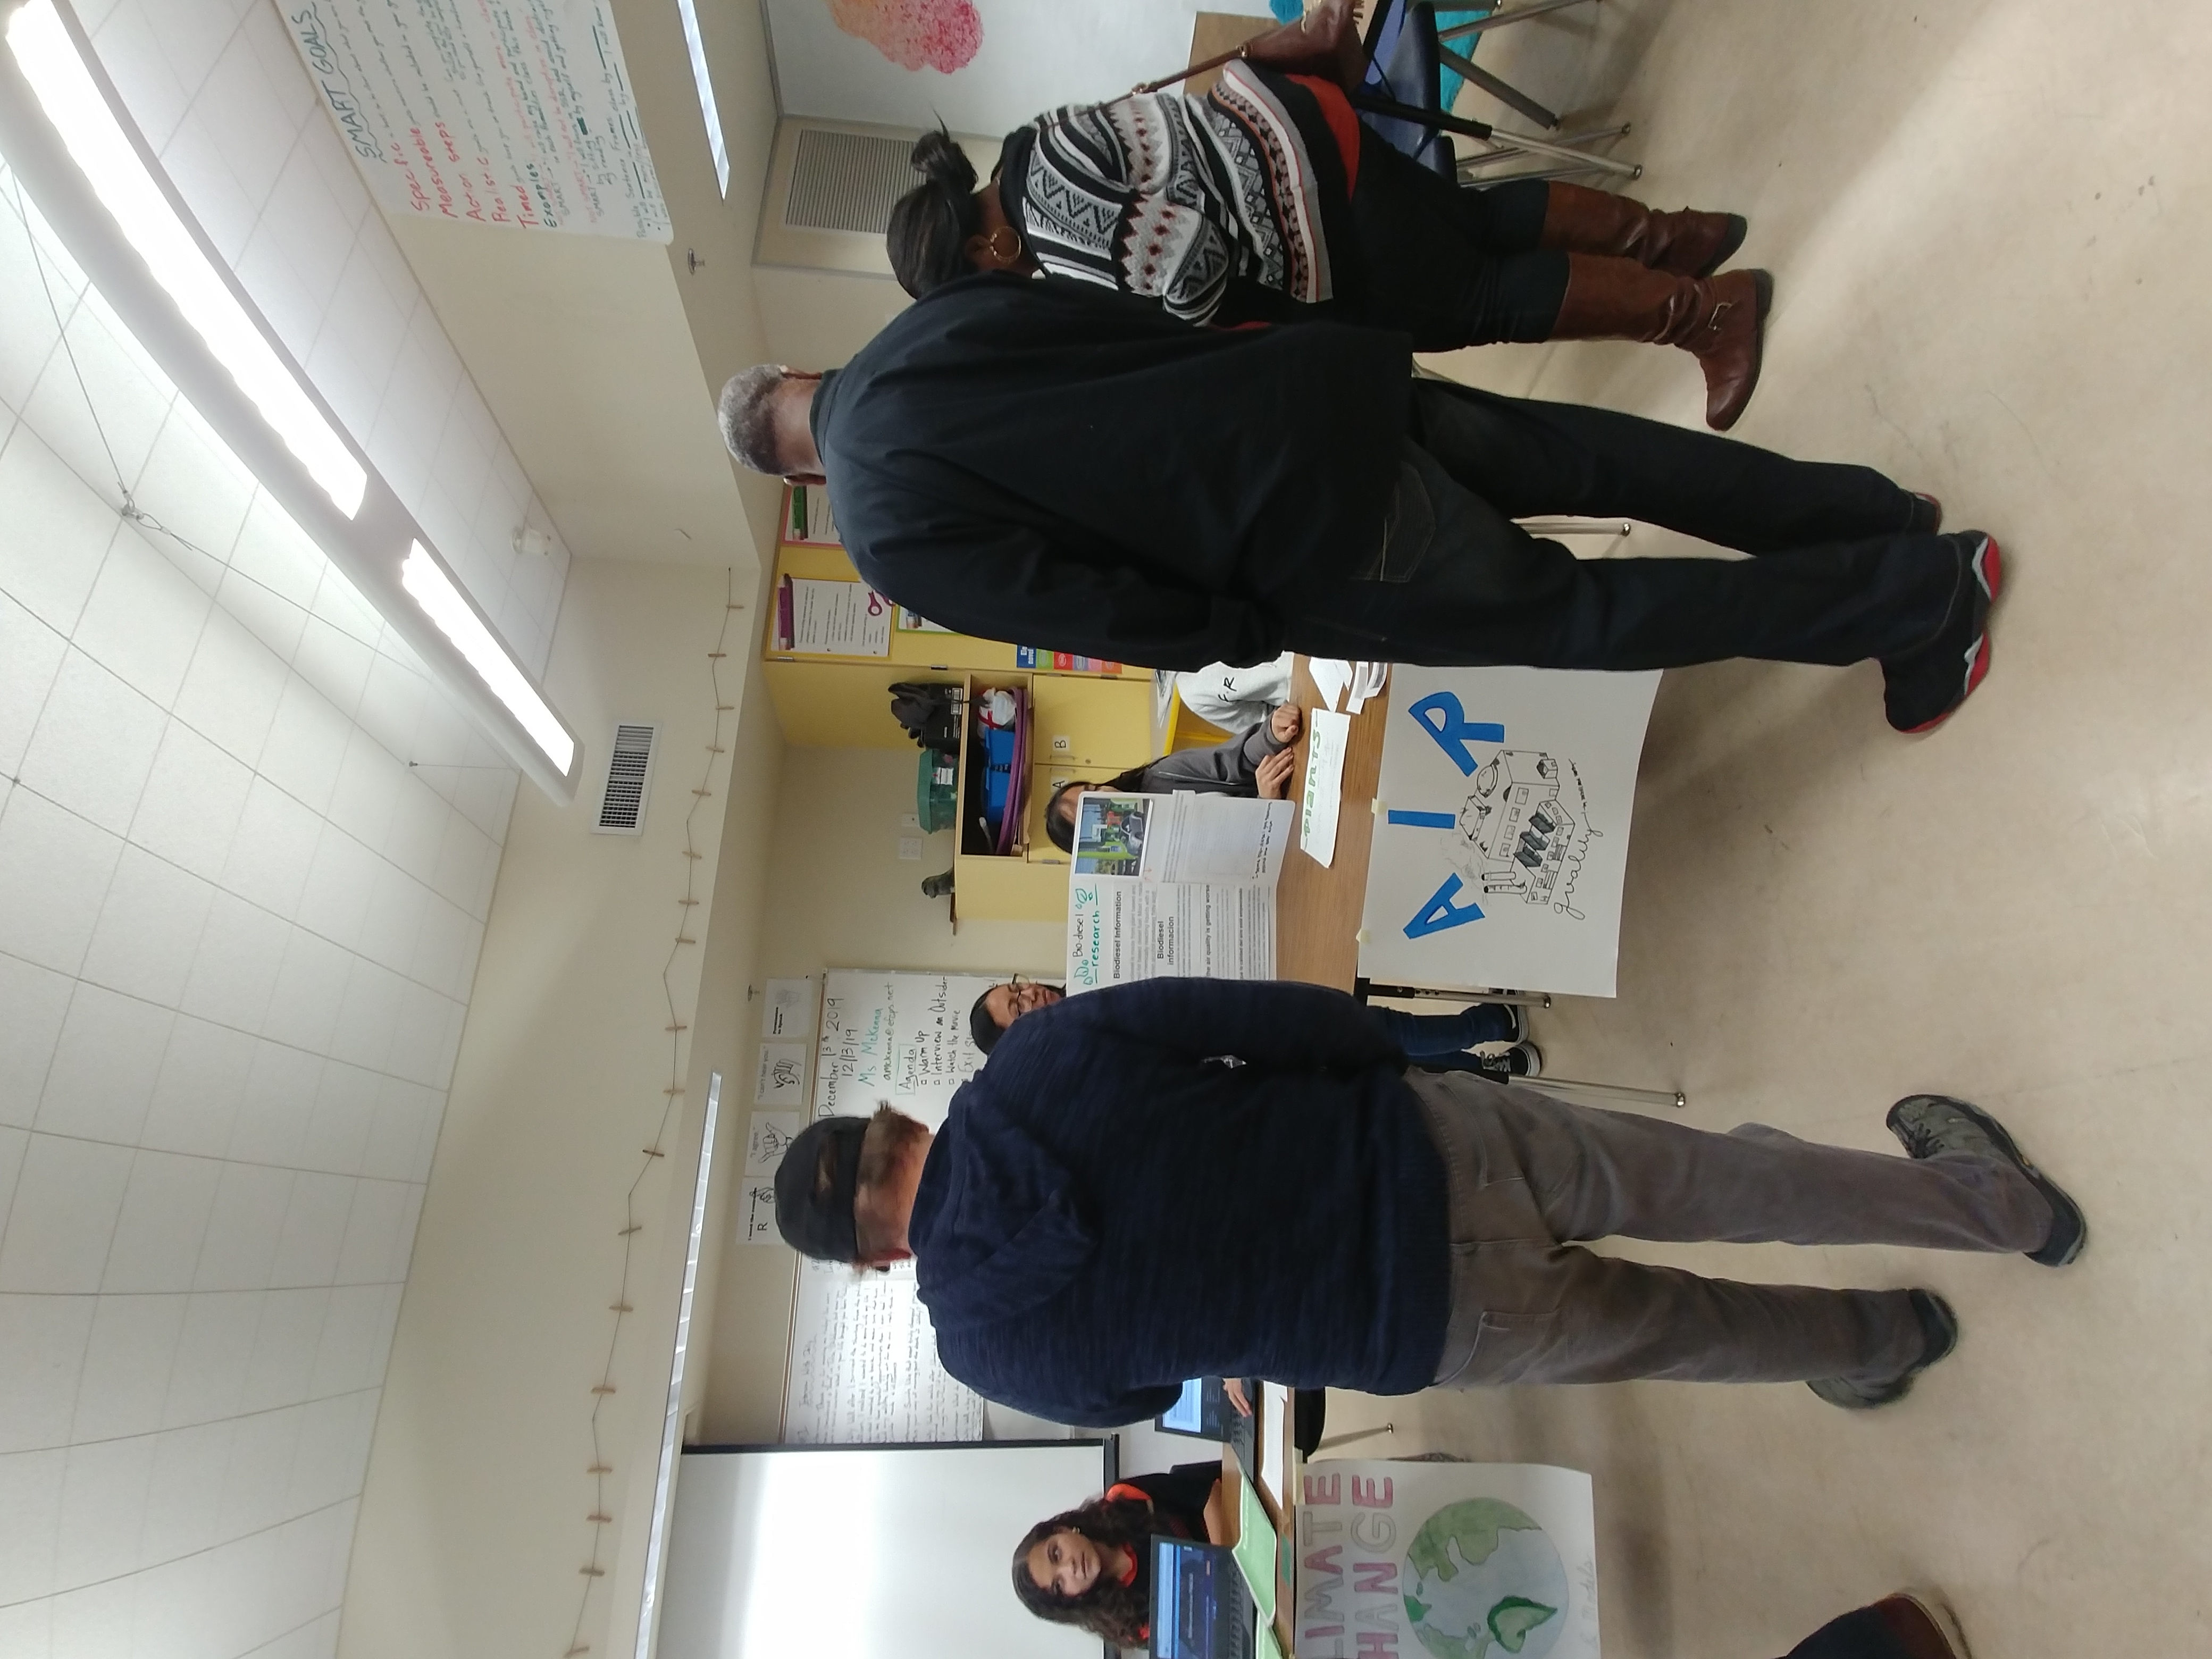
The students went even further. They noted both that they don’t have that many trees in Oakland, and that greenery plays a key role in filtering both air pollutants and greenhouse gases. So they worked to get more trees planted in their schoolyard.
The impact of those newly planted trees might seem insignificant in the face of the non-stop stream of carbon emissions occurring in their town. But the students understand they will contribute in a small way to the big picture. And that big picture is exactly where a NASA mission called OCO-2 comes into play: a satellite that captures data from high above Fruitvale and the rest of the globe.
Different Rooftop, Different Perspective
Just like Jess and her students, and the rooftop sensors they used, NASA’s Jet Propulsion Laboratory is also very interested in studying the gases pumped out by freeway vehicles and other human activity. In fact, JPL has launched several satellites to study just that. One of these, the Orbiting Carbon Observatory-2, or OCO-2, can measure carbon dioxide from space. So what might it tell Jess and her students about the impact of that freeway three blocks from their school?
If you think about it, satellite data from OCO-2 is also collected from a rooftop of sorts – the highest rooftop of all at the edge of the planet's atmosphere. Even though their perspective is vastly different, both satellites and local sensors are, at their core, trying to do the same thing: measure the total amount of carbon dioxide in a specific area. The more fossil fuel-based cars and buildings an area has, the more carbon dioxide the sensors should register.
But there are complications. For example, some of the carbon dioxide produced on a freeway will be blown by wind out of reach of the sensors. There might also be trees in the vicinity consuming carbon dioxide before the sensors ever measure it. In other words, neither rooftop nor satellite sensors are measuring one specific process, but rather the sum of many.
The key difference is that the rooftop sensors sum up processes happening around a city block, whereas a satellite in space sums up these processes over roughly one square mile. Data from the satellite cannot pick out a city street, or even a 10-lane freeway like the I-880. Hyper-local rooftop data like what Jess’s students used was perfect for that. On the other hand, if the students – or, say, city leaders – wanted to compare carbon dioxide concentrations over the San Francisco area with surrounding wilderness areas, JPL’s OCO-2 satellite data would better serve them.
And because OCO-2 observes the whole planet as it orbits, Jess’ students could even extend their comparison for cities world-wide, all courtesy of the same data source. For example, researchers using OCO-2 data compared carbon dioxide concentrations between urban and surrounding rural areas for over 80 cities in one fell swoop. It’s with this larger-picture perspective – regional, national, and global – where a satellite can really come in handy.
For Jess, the data makes a huge difference for her students. “It allows them to see the purpose of science, and realize they can do things to help their community. I prompt them to realize that, in using the data, they too become scientists.”